2026 Say on Pay Recap: Strong Results and Evolving Voting Dynamics

KEY TAKEAWAYS
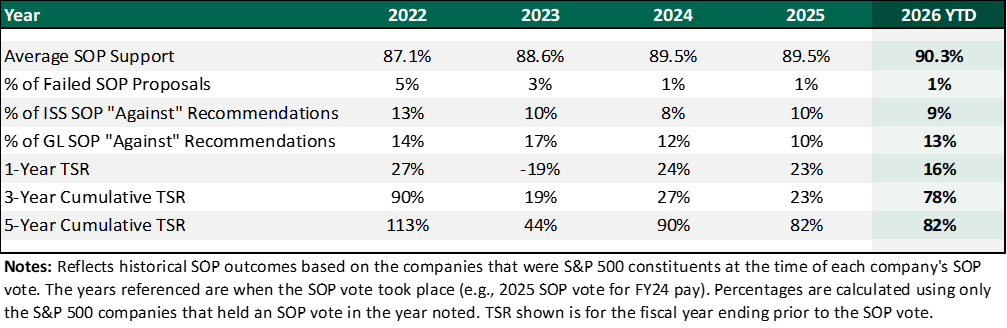
- 2026 is shaping up to be the strongest Say-on-Pay (SOP) season in recent history. Average S&P 500 SOP support reached 90.3%, the only time above 90% in the past 5 years.
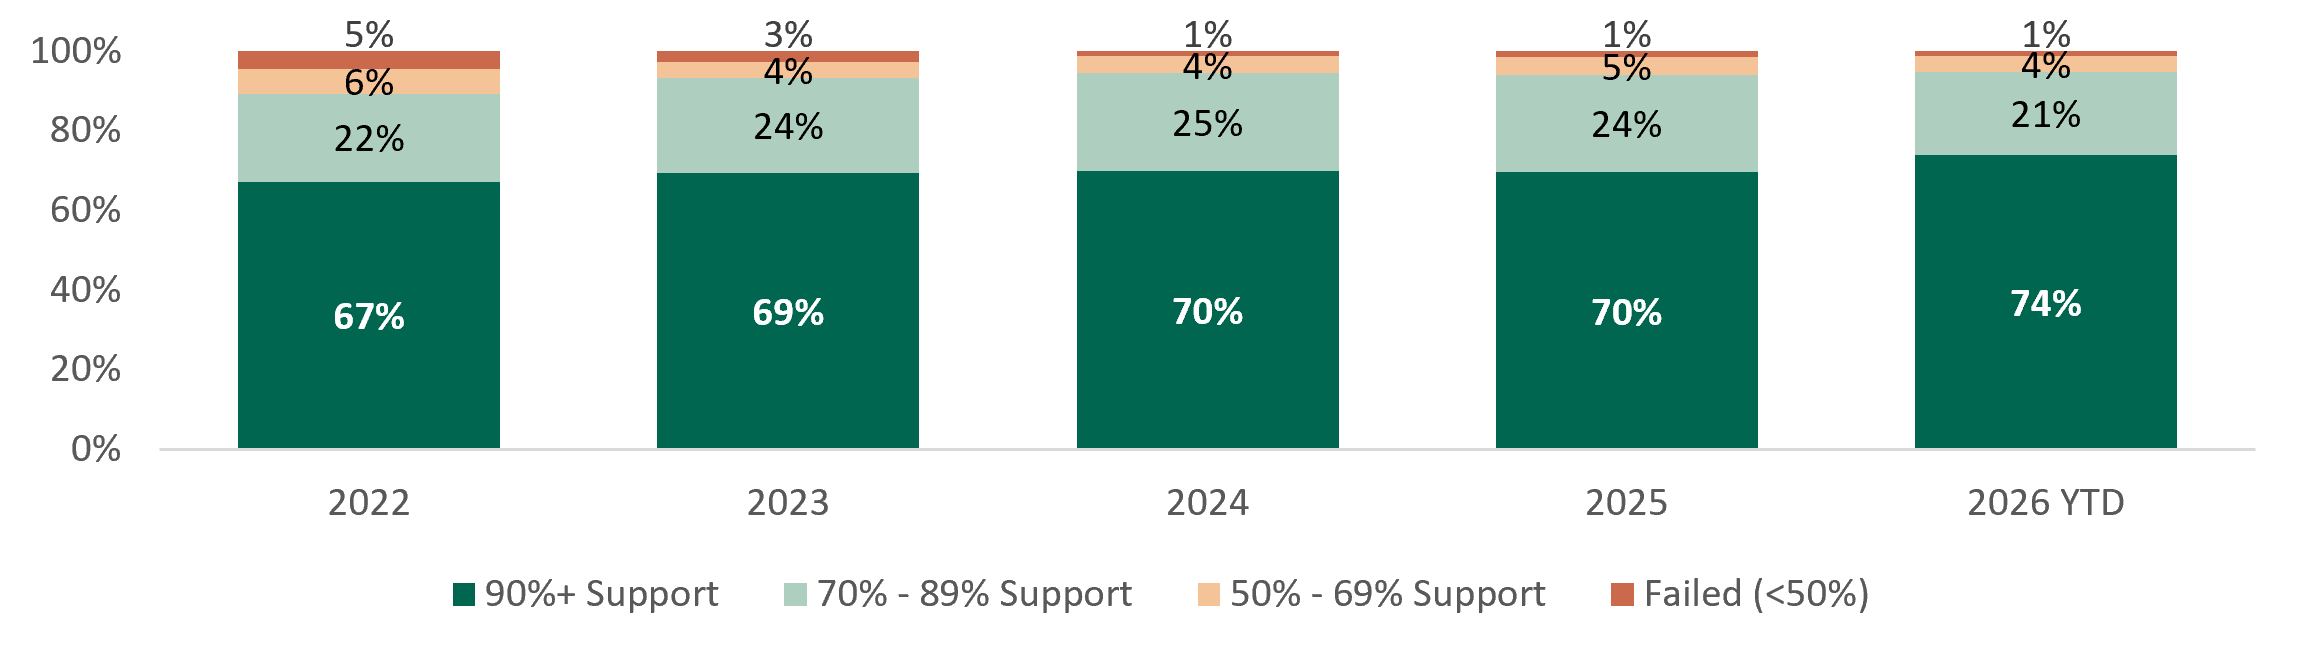
- Low support is less prevalent. Only 5% of companies received less than 70% support in 2026, down from 11% in 2022.
- Strong S&P 500 total shareholder return (TSR) coincided with favorable SOP results. Since 2024, SOP failures have remained at 1% of S&P 500 proposals while one-, three-, and five-year TSR results were strongly positive.
- Influence of proxy advisor SOP opposition continues to deteriorate. Institutional Shareholder Services (ISS) opposition declined to 9% year-over-year, while Glass Lewis (GL) opposition increased slightly to 13%. When both proxy advisors opposed SOP this season, only 19% failed to receive majority shareholder support, down from 50% in 2022.
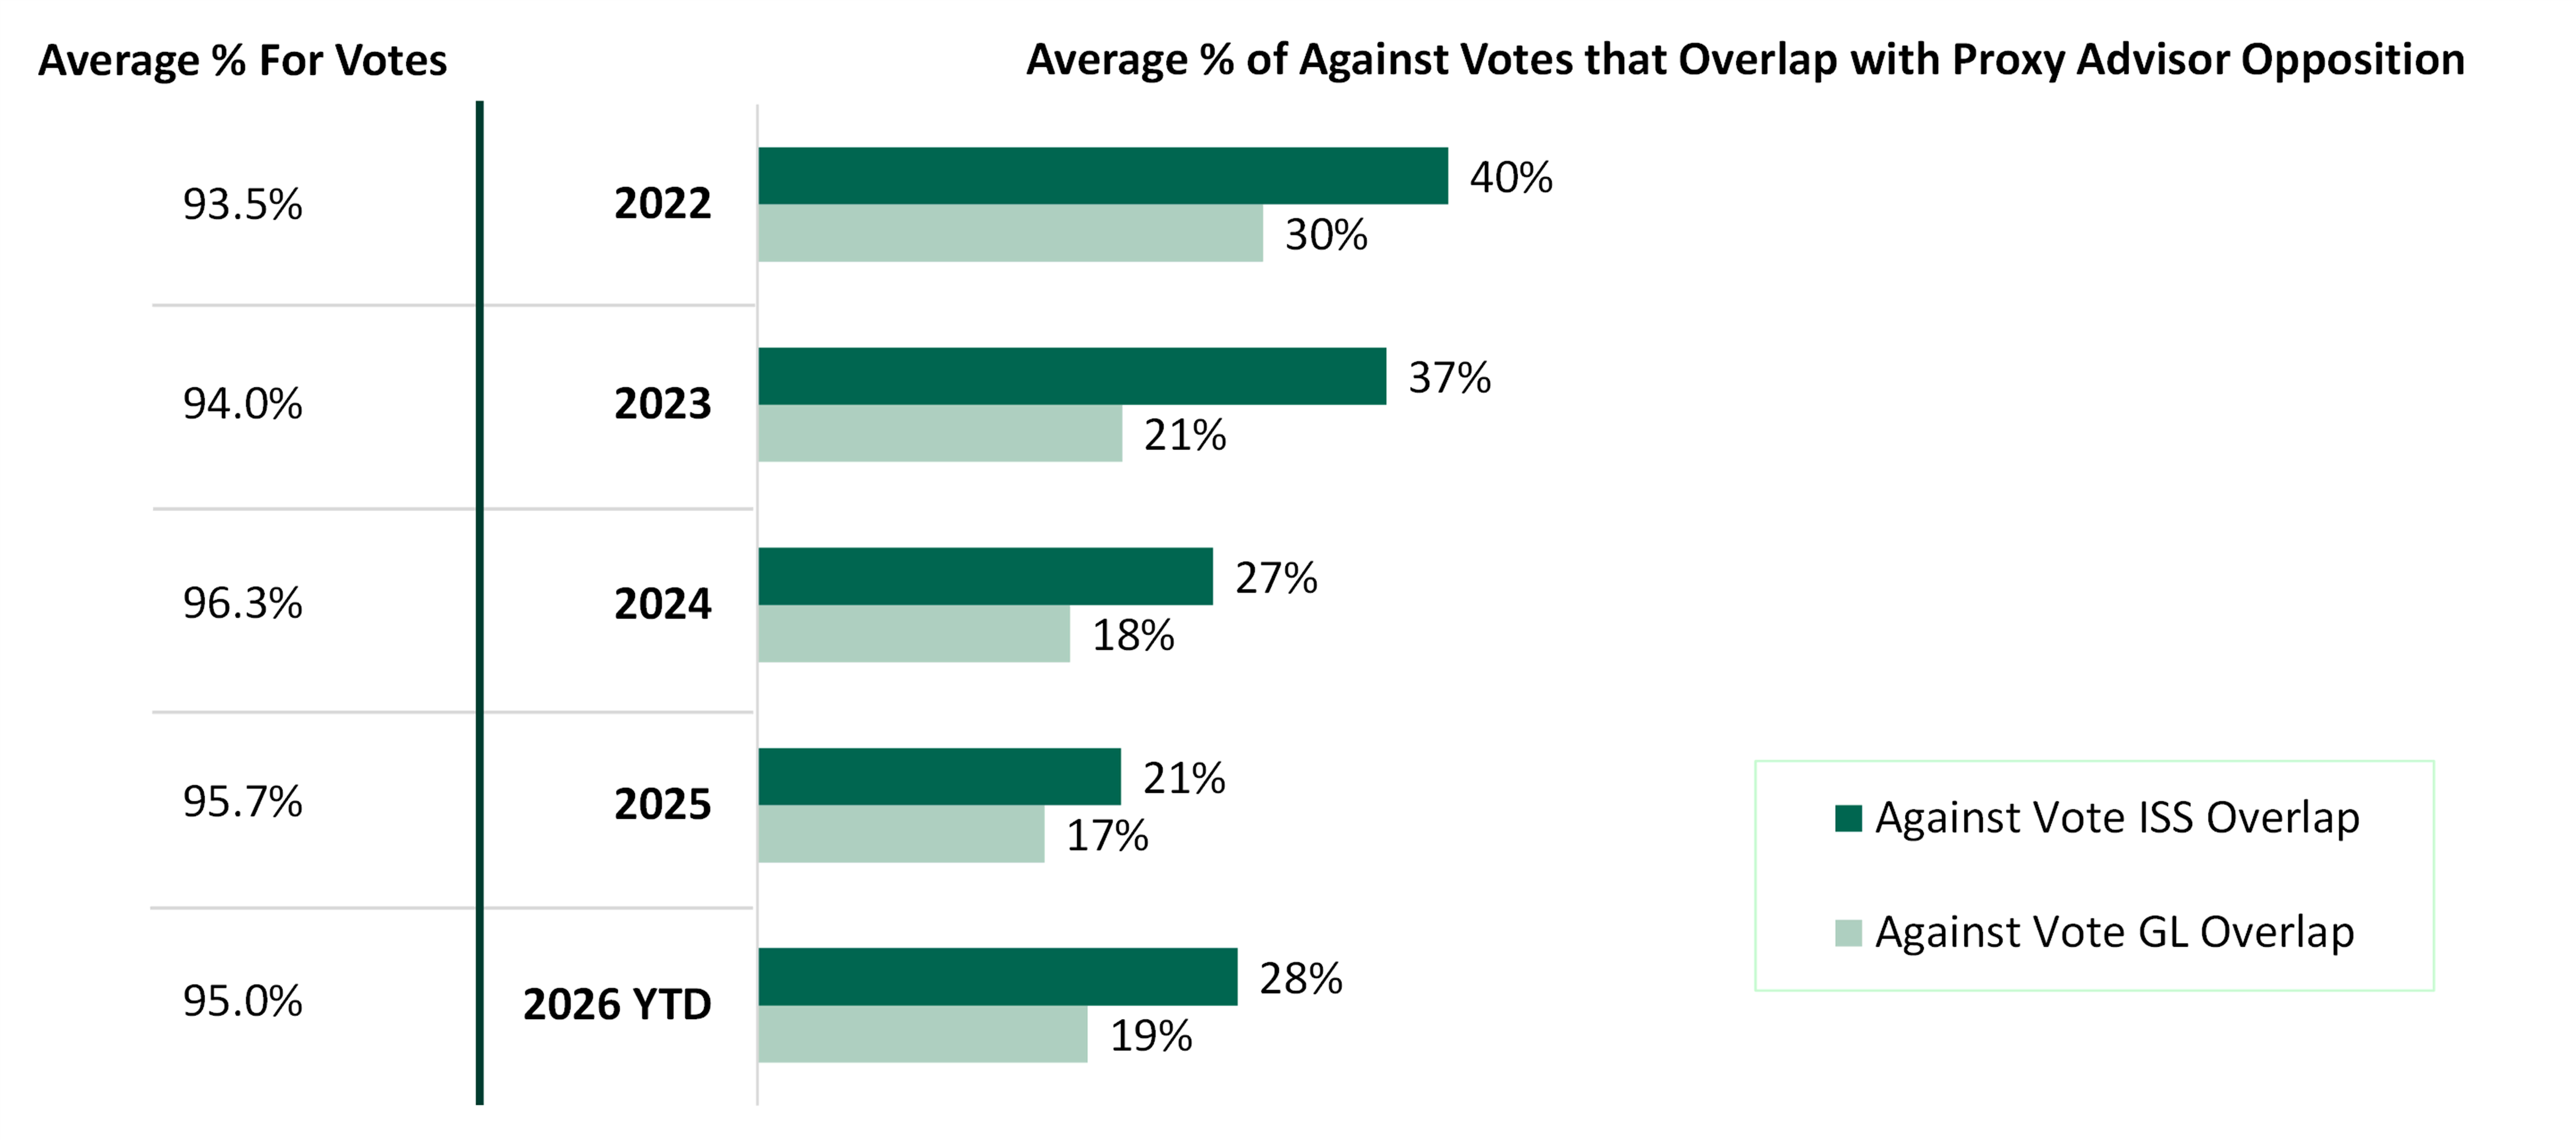
- The “big five” investors continue to take a selective approach to opposing S&P 500 SOP proposals and rely heavily on their proprietary voting frameworks. Top asset managers supported SOP at a rate of 95.6% in 2026 and deviated from proxy advisor SOP opposition in an overwhelming majority of cases.
- As the proxy voting landscape continues to evolve, understanding investor expectations and effectively communicating rationale for compensation decisions is critical to strengthening SOP support.

Strong S&P 500 SOP Outcomes in 2026
Thus far, 2026 reflects one of the strongest SOP seasons in recent years. With approximately 90% of S&P 500 companies having already held annual meetings by July 31, 2026, the current results provide a clear picture of the 2026 SOP environment. Average SOP support reached 90.3%, an increase from 89.5% in 2025 and 87.1% in 2022. The percentage of companies receiving at least 90% support increased to 74%, compared with 70% in 2025 and 67% in 2022. The improvement is also reflected in low levels of adverse proxy advisor recommendations and failed SOP votes, alongside strong, positive one-, three-, and five-year TSR performance.
Exhibit 1. Summary of S&P 500 SOP Outcomes and TSR Performance (2022-2026 YTD)¹
A failed SOP vote of less than 50% support is the clearest indication of shareholder dissatisfaction with executive pay. However, support below 70% creates heightened expectations for the disclosure of shareholder engagement and responsiveness in the following proxy statement. Analyzing trends in the sample of companies with low support may provide a better indication of shareholder concerns than focusing on failed SOP outcomes alone. As shown in Exhibit 2, only 5% of companies received less than 70% support in 2026, compared to 11% in 2022, demonstrating that the proportion of S&P 500 companies experiencing significant opposition is shrinking.
Exhibit 2: S&P 500 SOP Support Distribution¹
Deteriorating Proxy Advisor Influence
Diminishing proxy advisor influence is another important factor in the current SOP landscape and is underpinned by large institutional investors that rely on proprietary voting policies and conduct their own compensation analyses. As shown in Exhibit 3, the percentage of SOP proposals failing following an “Against” proxy advisor recommendation has declined steadily over the past five years. In 2022, 37% of SOP proposals opposed by ISS received a failing vote, while 25% of those opposed by GL failed. In 2026, only 13% of SOP proposals opposed by ISS and 9% of those opposed by GL failed to receive majority support.
Exhibit 3. Proxy Advisor SOP Opposition Impact (2022-2026 YTD)¹
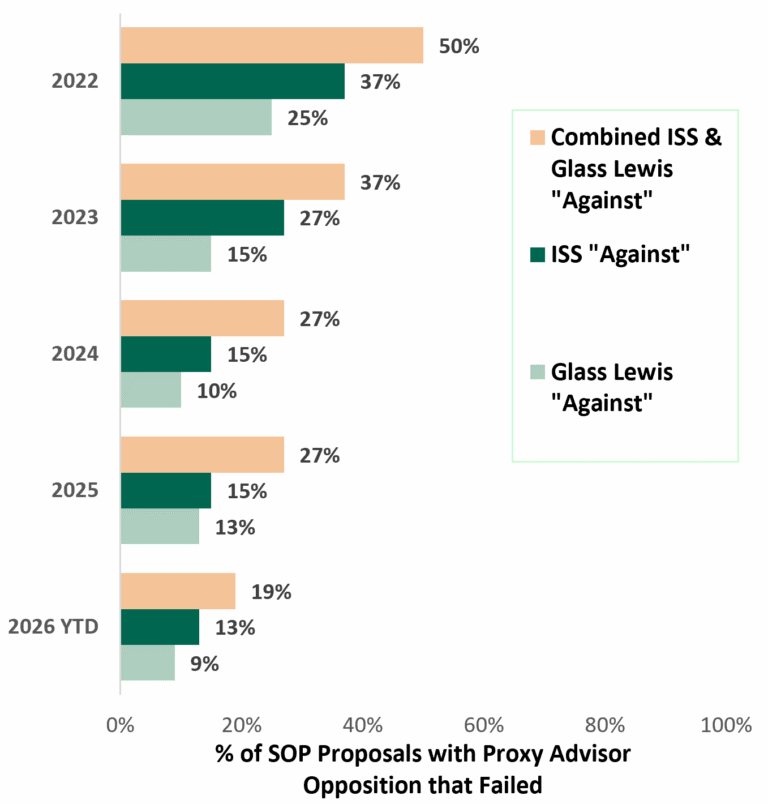
The trend is even more pronounced when both proxy advisors object to the SOP proposal. In 2022, half of SOP proposals opposed by both ISS and GL failed. That rate declined to 19% in 2026. These results suggest that proxy advisor recommendations have become less determinative of SOP outcomes. Even in cases of coordinated opposition from both major proxy advisors, over 80% of companies secure shareholder approval, reflecting major investors’ increasing reliance on their own assessments of executive compensation programs.
“Big Five” Voting Patterns
The voting patterns of the five largest institutional investors by assets under management—BlackRock³, Vanguard³, Fidelity Management & Research, State Street Investment Management, and J.P. Morgan Asset Management—reinforce the declining influence of proxy advisor recommendations. Average support of S&P 500 company SOP proposals by these institutions remained high in 2026, while overlap with proxy advisor opposition has fallen sharply since 2022. The aggregate overlap of these investors’ “Against” votes with ISS SOP opposition declined from 40% in 2022 to 28% in 2026, while overlap with GL fell from 30% to 19%. These trends underscore the importance of direct engagement with shareholders and understanding investor voting preferences.
Exhibit 4. “Big Five” Investor S&P 500 SOP Voting Patterns (2022-2026 YTD)¹
| As large investors rely on proprietary voting frameworks and increasingly diverge from proxy advisors’ guidance, understanding shareholders’ SOP voting policies and effectively communicating executive pay program alignment with investors’ expectations is essential. |
________________