Should Relative Financial Metrics be Considered for Companies that Struggle with Goal Setting in their Incentive Plans?

Introduction
One important responsibility of the Compensation Committee of the Board of Directors is to select performance metrics and set goals for company incentive plans in which senior executives and the broader employee workforce participate. The incentive plans are intended to motivate executives to execute and deliver goal-based results which are often tied to the company strategic business plan. Macroeconomic factors and/or industry wide instability may cause uncertainty and difficulty in setting performance goals for short-term incentive (STI) and performance-based long-term incentive (LTI) plans. Goals that are not set appropriately could lead to incentive plan payouts that are misaligned with shareholder experiences and/or demotivation of employees if plans consistently result in no payout. Companies facing challenges in goal setting may consider adopting less traditional, more flexible approaches to incentive design as discussed in our earlier Viewpoint “What You are Likely to Hear in the Boardroom”, which covers key developments facing Compensation Committees for the 2025-2026 cycle. Possible design considerations include:
- Exercising judgement/discretion
- Increasing the weighting of management by objectives (individual and/or corporate) or incorporating other non-financial metrics
- Widening performance ranges to better accommodate uncertainty and volatility
- Splitting annual incentive plans into two 6-month performance periods with aggregate payout at the end of the year
- Structuring performance share units as three discrete 1-year performance periods with aggregate payout at the end of 3 years (and combining with a 3-year relative total shareholder return (TSR) modifier to preserve long-term alignment)
- Using long-vesting restricted stock units or stock options to avoid the complexities of goal setting altogether
- Utilizing relative performance as an alternative to goal setting on absolute company performance
This Viewpoint takes a closer look at the potential to utilize relative financial performance (compared to a peer set or index) in lieu of traditional absolute performance, as a solution when facing difficulty in setting incentive plan goals. Our research looks at the use of relative financial metrics (excluding TSR) among the S&P 500 from 2019 to 2024.
Prevalence of Relative Financial Metric Usage in Incentive Plans Among the S&P 500
TSR is a common metric used in LTI plans among the S&P 500, with ~75% using the metric in 2024.[1] The use of relative TSR provides direct alignment with shareholder interests and is also advantageous from the standpoint of not having to set absolute financial goals. However, relative TSR can be influenced by factors outside of management’s control and provides less direct line of sight to the financial/operational goals the management team may need to focus on. Relative financial metrics, on the other hand, can provide direct focus to the management team on core financial measures in the company’s business plan while also avoiding the need to set goals in an uncertain environment. Our research shows that 3% of the S&P 500 utilized relative financial metrics in 2024 STI plans and 13% used them in LTI plans, which has generally held steady since 2019. The very low prevalence of relative financial metrics in STI plans may indicate that most companies have less difficulty in setting STI absolute goals at threshold, target and maximum performance levels; especially since goals generally align with annual business plans. Goal setting becomes even more challenging in LTI plans, as investor preference is for companies to adopt performance periods greater than 1 year.
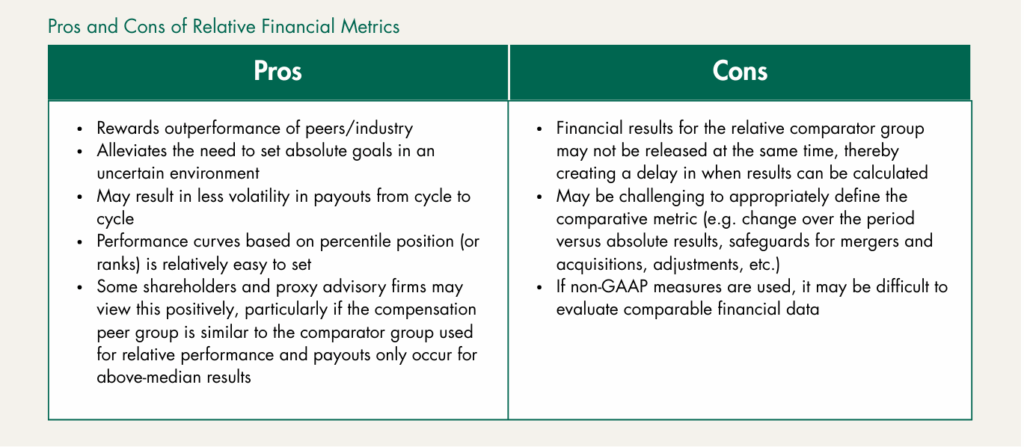
As mentioned in the table above, having current financial results in a timely manner for all comparators poses a challenge. Compensation Committees at companies with fiscal years ending in December typically approve incentive plan performance and payouts in the first quarter after the performance period ends. However, comparator financials may be filed after incentive plan performance and payouts need to be finalized and approved. This poses a potential constraint when using relative financial performance metrics. One workaround to this issue is basing relative results on the most recent filings over the measurement period as of a cut-off date. For example, a company using a 3-year performance period can designate a comparator filing date cut-off as of January 15th following the end of the performance period and measure performance based on the most recent financial filings over the 12 consecutive quarters prior to the cut-off date. This would be a consistent approach for all comparators. Companies considering this approach would also need to consider using GAAP measures as opposed to non-GAAP to have comparable results across the comparator group. It would be difficult and time consuming to apply non-GAAP adjustments to metrics consistently and accurately across a comparator group.
Prevalence of Relative Financial Metrics by Industry
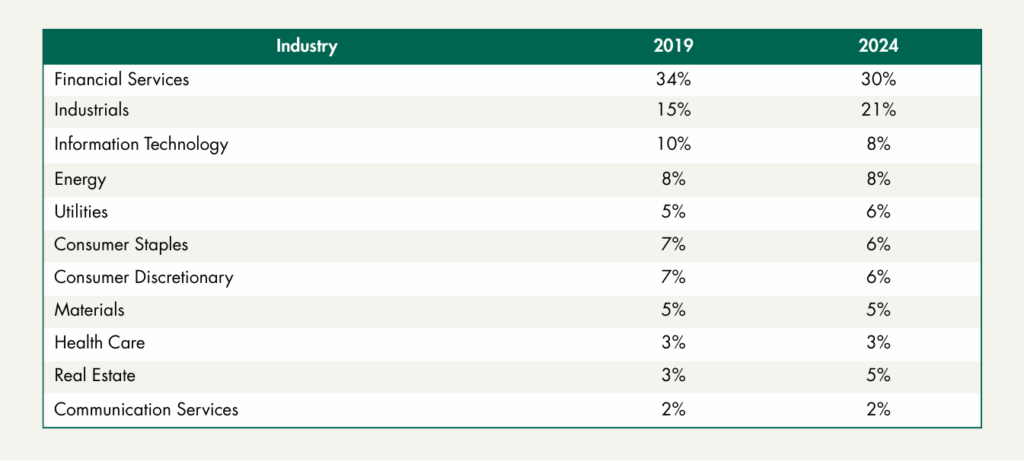
Of the companies in the S&P 500 that utilized relative financial metrics, companies in Financial Services and Industrials use them the most, with prevalence of 30% and 21% respectively in 2024. The prevalence of relative financial metrics by industry has generally held steady since 2019.
The prevalence is higher in Financial Services and Industrials industries, likely due to the homogeneity of peers and/or companies in industry related indexes which helps facilitate relative comparisons. In other industries, the use of relative financial metrics can be viable when utilizing a thoughtfully selected peer group or index. Back-testing of relative performance and corresponding incentive plan payouts can be very informative as to the reasonableness of this approach for a particular company (e.g., a reasonable distribution of performance and payouts aligned with the shareholder experience).
Prevalence of Relative Financial Metric Categories and Typical Structure
Of the companies in the S&P 500 utilizing relative financial metrics in their incentive plans, return and profit metrics are the most prevalent, followed by revenue. Return metrics include metrics such as return on equity and return on capital. Profit metrics include metrics such as earnings per share, operating margin, and net income. For both relative profit and revenue metrics, performance is typically measured in terms of growth over a specified period, regardless if included in STI or LTI plans. Among LTI plans, the most common performance period is three years.

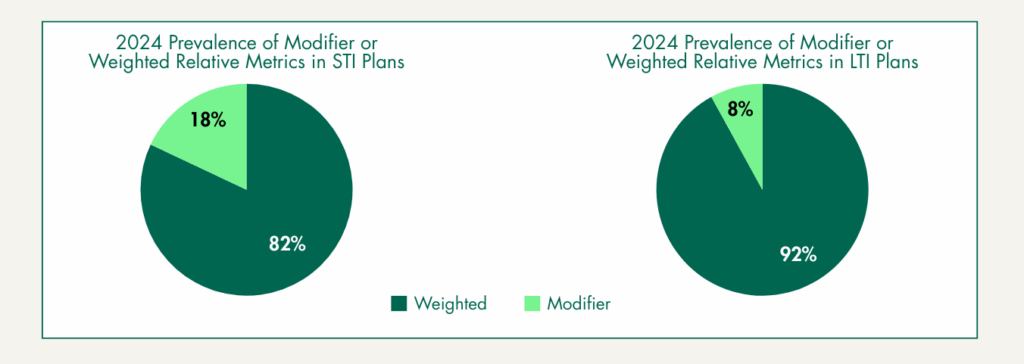
The majority of companies using relative financial metrics incorporate them as weighted metrics as opposed to incorporating as a modifier on the overall results.
Relative Performance Metric Comparator Groups
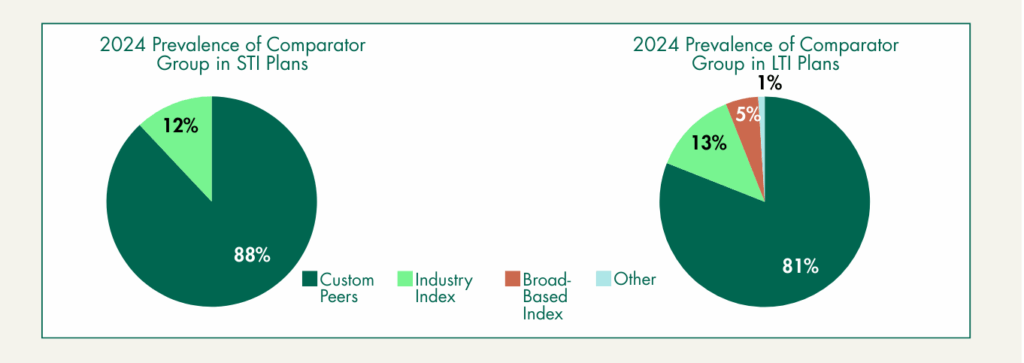
When measuring relative performance, most companies compare their performance against a custom peer group, followed by an industry index. Companies develop a custom peer group or use an industry index with the intent to measure against companies which have similar business characteristics and impacted by external factors in similar ways.
Conclusion
For companies facing uncertainty and difficulty in setting goals, the use of relative financial metrics can be another design feature to consider for LTI and/or STI plans with thoughtful discussion and planning. When planning, components for the Compensation Committee and management to deliberate on include:
- Type of financial metrics
- Comparator group: custom peer group or index
- Weighted metric or modifier
- Measurement period
In addition, back-testing of relative financial metric performance and corresponding payouts can be informative to determine if this approach will be reasonable for your company.
General questions about this Viewpoint can be directed to: Marizu Madu (marizu.madu@paygovernance.com).
______________