Lower Performance for Target Pay? How Companies Address Pay-for-Performance Alignment in Times of Declining Performance

Key Takeaways
- Ensuring pay-performance alignment is challenging enough when a business is performing well, but this task becomes more difficult when business results are down from the prior year.
- Today’s investors and proxy advisors are more interested than ever in performance measures and the rigor of performance goals.
- Any indication of declining incentive goals can bring heightened scrutiny, including an increase in the likelihood of an “against” Say-on-Pay vote recommendation.
- Companies can address periods of lower performance in their incentive plans while maintaining alignment with shareholders a number of ways.
- Regardless of the approach used, thoughtful and transparent disclosure will go a long way toward gaining the understanding and support of shareholders and proxy advisors.
Ensuring alignment between pay and performance is challenging enough when a business is performing well. But what about during times of an industry or economic downturn, waning company performance, a shift in strategic business focus, or a period of investment when performance expectations are not as high as in recent years? Today, institutional investors and proxy advisors are hyper-focused on pay-for-performance alignment and, by extension, the rigor of performance goals. Any indication of declining incentive goals year-over-year can bring heightened scrutiny, negative commentary, and can increase the likelihood of an “against” Say-on-Pay (SOP) vote recommendation from proxy advisors. What alternatives exist for a company facing the prospect of performance expected to be lower than the prior year? What should be considered in setting incentive plan goals and what can be expected from shareholder watchdogs who closely examine performance goals and alignment with shareholders?
A recent study by Institutional Shareholder Services of over 2,000 companies indicated that 31% of short-term incentive goals and 22% of long-term incentive goals were lowered from FY2014 to FY2015. As these findings highlight, many companies find themselves in the position of how best to address performance goals that are lower year-over-year while ensuring that shareholder interests are not neglected.
For many of these companies, the lowering of performance goals might be due to explainable events (e.g., a divestiture that reduces the size and scope of operations) or other factors outside of the control of the company (e.g., an economic or industry downturn). In these instances, a full and clear discussion of these factors and the associated implications on executive incentive compensation plans in public filings will go a long way toward gaining the understanding of shareholders and proxy advisors.
But what about instances that are not due to changes in business structure or were not due to factors outside of management’s control that have resulted in lower performance expectations?
What alternatives exist that can help ensure management isn’t rewarded for previous failure or for simply “getting back to where it was before?” What measures can be taken to help better align incentive programs with shareholder interests in these instances?
Below we outline several approaches that companies have used when performance expectations are lower than prior year actual or target performance:
1. Increase Performance as a Percent of Target Required to Earn Target Payout
In order to earn the target bonus, the required performance must be something above what is budgeted (e.g., 105 % of goal, 110% of goal, etc.). For example, assume a company uses net income for its annual incentive plan performance metric, which is based on its budget that takes into account analyst expectations and is communicated externally to the street as the Company’s guidance. In this example, let’s assume the Company and analysts expect net income to be around $100 million for the year and this is lower than the prior year. Under this scenario, the annual incentive plan “target” performance that would earn the target payout would be set at something above $100 million, perhaps $105 or $110 million or targeted at net income at least commensurate to prior year actual. Judgment would need to be applied in establishing the level of target performance that would result in target payouts for the annual incentive plan (and payouts for performance above this level), but the idea is that management needs to perform better than internal/external expectations to earn a target payout for the year. In doing so, management effectively takes a haircut to its potential payout for achieving budgeted results, which are lower than the prior year and, thus, takes a smaller share of the profits with a larger portion going to shareholders in recognition of the down year (e.g., achieving budgeted net income of $100M results in a payout at 90% of target rather than 100% of target).
A graphic illustration depicting this approach vs. a traditional approach (i.e., a standard year where performance is not expected to be lower than the prior year) is presented below:


As shown in the above charts, under this “modified” approach, greater levels of performance relative to the “traditional” approach are required in the payout zone to achieve the same level of payout (e.g., 105% of target performance results in 100% of target award vs. traditional curve that requires 100% of target performance to earn 100% of target award). Thus, this approach attempts to recognize that performance expectations are lower than prior years by requiring a greater level of performance under the circumstances to achieve otherwise customary target payout levels.
2. Set Target Performance at Budget but Increase Threshold and Maximum Performance Goals
Here, target performance is set at budget (even though it represents lower performance relative to the prior year) but threshold and maximum performance levels are raised to recognize lower performance expectations for the year. Note: this approach also can incorporate a lower payout for “target” performance as discussed above; we present modification only of threshold and maximum performance goals in this example for simplicity.


As can be seen in the above charts, under this approach greater levels of performance relative to the “traditional” curve are required to earn threshold and maximum bonus payouts (e.g., 90% of target performance is required to achieve a threshold payout vs. “traditional” curve that requires 80% of target performance to earn a threshold award, and 150% of target performance is required to achieve a maximum payout vs. “traditional” curve that requires 120% of target performance to achieve a maximum payout). Thus, this approach attempts to recognize that performance expectations are lower than prior years by requiring a greater level of performance to earn a threshold and maximum award.
3. Shift in Performance Focus
Another method some companies employ is to shift the performance focus within the incentive programs. This could be achieved by changing the relative importance of performance metrics via adjustments to their weighting and/or by introducing new metrics that are more aligned with and reflective of the current environment and strategic expectations. Such an approach might be more apt in situations where lower goals are driven by a strategic business shift – e.g., during a period of investment that is meant to produce long-term value in exchange for a period of slower short-term growth – than in situations where company- or industry-specific circumstances are resulting in lower performance.
For example, a company might consider increasing the weighting of forward-looking strategic milestone-based measures and decreasing the weighting on backward-looking financials, as this would encourage and provide an incentive to focus more on initiatives that are aligned with long-term strategic performance and returns but that cannot be measured directly over the short-term through annual financial results. Alternatively, a company emerging from a period of high growth into more mature, sustainable levels of performance might consider a shift from growth measures (which would show lower performance expectations) to a profit or margin measure intended to refocus management on sustainability and operational excellence when growth expectations may have flattened.
We note that particular care must be taken to ensure alignment with shareholders is maintained when considering such alternatives. Further, the importance of disclosure of the context and specific rationale for making such a change increases as the adoption of strategic milestone / non-financial incentive goals can come with its own set of scrutiny from proxy advisors (and especially so during times of lowered financial expectations).
4. Do Nothing / Use Discretion
Target performance is set at the budgeted lower performance expectation and performance and payout curves around target are set as they normally would be (i.e., no adjustment in recognition of lower performance expectations for the year). For many companies, the understanding is that the Committee may exercise its discretion to adjust awards based on its evaluation of company performance at year-end.1 This approach may make most sense for businesses that regularly experience some minor volatility in performance results from year to year or where performance is not significantly off from the prior year, and so, no significant deviation from “business as usual” is deemed necessary.
IN PRACTICE
Pay Governance reviewed a sample of 32 companies that had lowered their target performance goals in incentive plans year-over-year to understand how lower performance expectations and goals were addressed in the incentive plan design, the level of disclosure regarding the circumstances impacting performance and incentive programs, and ISS’s associated reaction.
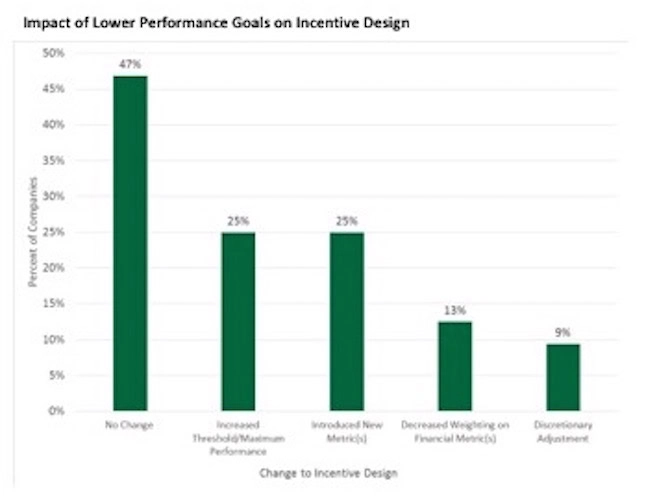
As can be seen above, nearly half of the companies reviewed lowered performance goals for which target payout is earned but made no other change to the incentive plan or provide any indication that Committee discretion would be used for adjustments. Separately, an equal number of companies either raised threshold and maximum performance levels (25%) or shifted performance focus by introducing a new metric to offset lower performance expectations for other financial measures used in the plan (25%), likely due to a strategic shift in their business. Fewer companies decreased the weighting on financial metrics or indicated that Committee discretion would be used to make adjustments following the end of the performance year.
Interestingly, the magnitude of change in performance goals does not appear to have a significant impact on the type of approach used by companies to address lower performance expectations. As seen below, the data indicate that companies’ methods for addressing lower performance in their incentive plans are varied regardless of the degree to which performance goals differ from the prior year, indicating that situational factors – as opposed to the magnitude of decrease in performance goals – play a more influential role in determining how companies choose to address this issue in their plans.

DISCLOSURE OF RATIONALE AND ISS REACTION
To understand company disclosure of and ISS’s reaction to the lowering of performance goals, we reviewed CD&A disclosure and ISS reports for each of the 32 companies in our sample. Within the ISS reports we looked for ISS’s overall vote recommendation for Say-on-Pay, specific commentary from ISS on the lowering of performance goals, and the level of concern provided within the 5 evaluation components ISS summarizes – Non-Performance-Based Pay Elements, Peer Group Benchmarking, Severance/CIC Arrangements, Comp Committee Communication / Responsiveness, Pay for Performance Evaluation.
Overall, our findings indicate:
- Exactly half of the companies reviewed provided some specific explanation of the rationale for lowering goals vs. prior year to their shareholders in the proxy statement CD&A. Such disclosure ranged from brief statements about industry-specific conditions (e.g., lower commodity prices) to detailed explanations of a new strategic direction to discussions of broader economic conditions.
- Companies that provided a discussion of the rationale for lowering goals received a greater proportion of “against” say-on-pay vote recommendations from ISS than companies that did not provide any discussion of rationale (47% vs. 33%); however, this group also had a higher proportion of Medium or High concerns on ISS’s pay-for-performance test (ISS’s main determinant for its say-on-pay vote recommendations), which likely explains the need for disclosure of the circumstances surrounding lower performance goals to help ISS and institutional investors understand management’s rationale.
- Interestingly, we find that 40% of the companies that lowered performance goals received an “against” vote recommendation from ISS, significantly higher than ISS’s overall “against” rate of 12% for the Russell 3000. These companies were also more likely to receive a Medium or High concern from ISS for its pay-for-performance test (53%) than among the broader Russell 3000 companies (~25%), underscoring the importance of providing clear disclosure surrounding the lowering of performance goals to help mitigate these concerns.

These findings show that, while there may be other factors at play, some level of increased scrutiny and likelihood of an “against” vote recommendation can be expected from ISS when a company decreases goals year-over-year. This highlights the importance of greater transparency and communication to shareholders who understand the complexities of the business and circumstances affecting the Company and its pay programs, perhaps even beyond what is provided in the company’s CD&A disclosure.
____________________________________
Footnotes
1. Consideration needs to be given to qualifying awards for IRC Section 162(m) tax deductibility.
General questions about this Viewpoint can be directed to Jeff Joyce or Brian Lane by email at: jeff.joyce@paygovernance.com or brian.lane@paygovernance.com.