Biotech Industry Trends in Equity Compensation: Influence of Market Volatility on Equity Program Strategy

- Increase in the use of restricted stock and restricted stock units (RSUs) which marks a deviation from the traditional 100% options approach for many biotechs – mix of options and RSUs is the new norm for pre-commercial biotechs.
- Annual equity usage increased to historical highs and to rates above evergreen refreshes, leading to higher levels of dilution to shareholders from outstanding equity awards.
- Decreased levels of available employee share pool reserves which could result in an increase in share reserve requests over the next few proxy seasons.
Introduction
The biotech/pharma1 industry has experienced extreme volatility in the past 3-5 years. The period of late 2018 to mid-2021 brought rapidly-rising valuations, a seemingly unending source of investor funds for private financings, and a record-breaking number of initial public offerings (IPOs). Since mid-2021, however, valuations have declined and the IPO market has dried up, leaving many companies with sustained lower valuations, limited access to cash, highly dilutive capital raising events, and/or downsizing.
In reaction to these changes, compensation practices have shifted — particularly within equity compensation programs, which are heavily relied on by biotech companies, as a large component of incentivization, shareholder alignment, and potential wealth creation for their employees.
In addition to other talent-related questions, recent market conditions have led Compensation Committees to think differently about their pay strategy, leading them to question several long-standing industry compensation practices: the broad-based participation of an all-options-equity program, for example. From late 2021 through 2023, many Compensation Committee conversations have focused on the effectiveness of stock options as the sole equity vehicle in a down market. As stock options fell and remained underwater, Committees were eager to discuss alternative ways to retain, incentivize, and re-engage the workforce.
Many Committees acted — incrementally or otherwise — resulting in the following changes in equity strategy and design:
- Increased use of restricted stock and restricted stock units (RSUs)
- Increased rate of aggregate annual equity usage (“burn rate”)
- Increased level of automatic equity reserve refresh rates and reliance on such refreshes (“evergreen provisions”)
- Decreased levels of available shares authorized for grant to employee (“share pool” or “equity reserves”)
- Increased levels of outstanding employee ownership (dilution)
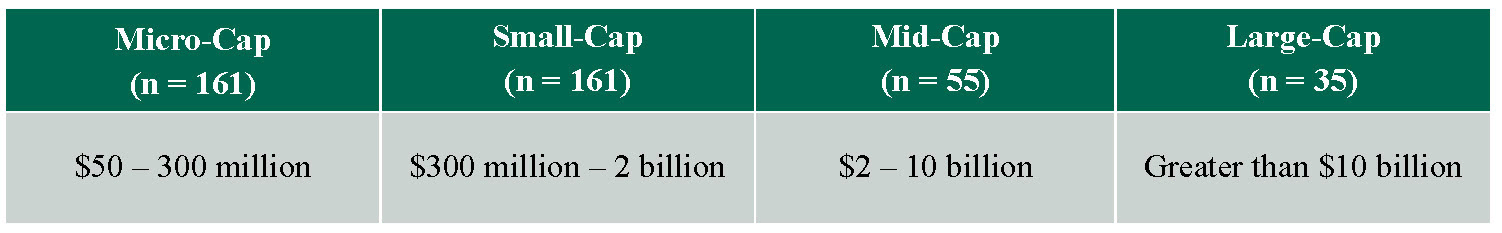
To test our recent experience, Pay Governance analyzed over 400 biotech companies with greater than $50 million in market capitalizationto understand variations across companies of different sizes.2 We segmented the overall group into the following categories based on market capitalization (see Figure 1):
Figure 1.
Equity Mix — Increase in the use of RSUs
The use of stock options has been, and still is, a predominant industry-wide practice — particularly for early stage and pre-commercial companies. Options have many benefits: in particular, their appreciation-based design aligns award recipients with shareholders, whereby value is only realized with an increase in share price. However, in this environment, significantly underwater options have put pressure on many companies’ equity incentive programs, requiring many to consider different approaches.
Historically, RSUs are added to the equity award mix at a later stage in a biotech company’s life cycle or at more highly capitalized companies (e.g., recent commercialization, after significant share price growth and stabilization, etc.). In fact, RSU usage has remained relatively stable over the last 3 years among the mid- and large-cap companies we reviewed. Conversely, however, we have observed a marked increase in the prevalence of RSUs among micro- and small-cap companies which have traditionally been more likely to adhere to an all-options approach.3
Since 2020 (as shown in Figure 2), the prevalence of RSUs has increased from 39% to 51% at micro-cap companies and from 53% to 68% at small-cap companies, whereas at mid-caps and large-caps, RSU usage remained stable at approximately 80% and 90% of companies, respectively. Note that this increase in RSU usage is in conjunction with continued stock option usage. Most often, micro- and small-cap companies adopt RSUs in addition to using stock options as opposed to using RSUs as a single long-term investment (LTI) vehicle.
Figure 2.

Pay Governance attributes this increase in RSU usage at micro- and small-caps to three main factors:
- Retention: Fiscal years 2021–2022 were incredibly difficult from a share price perspective for micro- and small-cap companies, with total shareholder return down by -76% and -44%, respectively, at median. Additionally, many of these companies underwent dilutive financing events to continue operating, further intensifying downward pressure on share prices. These phenomena have contributed to an overall decline in the realizable value of granted equity awards and, in particular, stock options. Since RSUs do not require share price appreciation to provide intrinsic value (i.e., the difference between the price at exercise and the grant price of an option), they improve retention, particularly by retaining value even in down markets. Therefore, companies have begun to include RSUs in their annual equity grant program mix earlier in their lifecycle and many, over the course of 2022, administered off-cycle retention programs that awarded RSUs.
- Competition for Talent: The labor market for talent in the biotechnology space — while always highly competitive — was even hotter in 2020 and 2021, driven in part by the influx of cash and a focus on growth. Many micro- and small-cap companies who are in pre-clinical or clinical phases adopted RSUs to help recruit much-needed talent from the mid- and large-cap companies where the use of RSUs is already highly prevalent and well understood by employees.
- Share Reserve: With share price declines, companies are required to deliver more shares to employees to deliver economic value commensurate with levels made in higher stock price environments. This has put pressure on equity plan reserves. Since the economic value of one RSU is greater than one stock option, companies can deliver fewer RSUs for the same dollar value at grant. Therefore, RSUs are less dilutive than an option award which, all else equal, can help with the conservation of equity share reserves.
Burn Rate — Increase of Annual Equity Usage
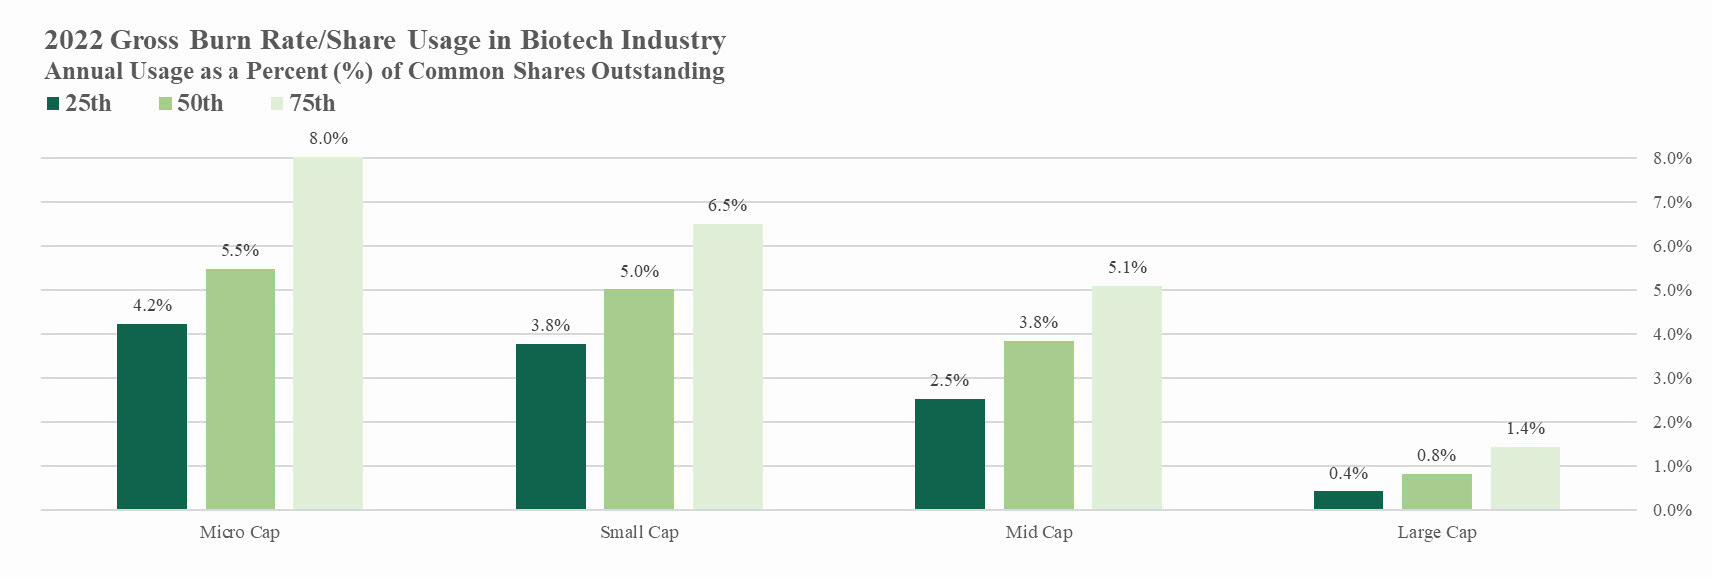
Annual gross burn rates (the percentage of outstanding shares that a company grants annually to employees, exclusive of forfeitures) for micro-, small-, and mid-cap biotechnology companies have historically sat in the range of 3.5–4.0% of common shares outstanding (CSO), this drops off significantly for large-cap companies. However, in fiscal year 2022 we observed a substantial increase in share usage across most company sizes (see Figure 3) .
Figure 3.

Aggregate annual grants tend to be targeted by companies at a level that is slightly less than their annual evergreen rate (which is sometimes seen as an upper limit for annual share usage). Evergreen rates are typically 4–5% of CSO (note that the “evergreen rate” is the proportion at which share pools increase programmatically and annually for companies with plans that have such a provision). However, in 2022, gross burn rates often exceeded this refresh rate, particularly among micro- and small-cap companies where median burn rates exceeded 5% and even higher at the 75 th percentile: 8.0% and 6.5% for micro- and small-caps, respectively (see Figure 4) .
Figure 4.
Given the number of layoffs (and consequent share cancellations) that occurred in 2022, one might expect equity usage rates to decrease (i.e., companies having fewer employees to distribute equity), but this was not the case. This leads us to believe that companies deployed additional shares to their remaining employee populations (e.g., through larger-than-typical annual awards or through retention grants).
As stated above, typical evergreen rates hover between 4–5%. Historically, the most common evergreen rate implemented at IPO has been 4%, but this has trended upwards lately with recent IPOs more commonly implementing annual evergreen rates at 5% (see Figure 5).
Figure 5.
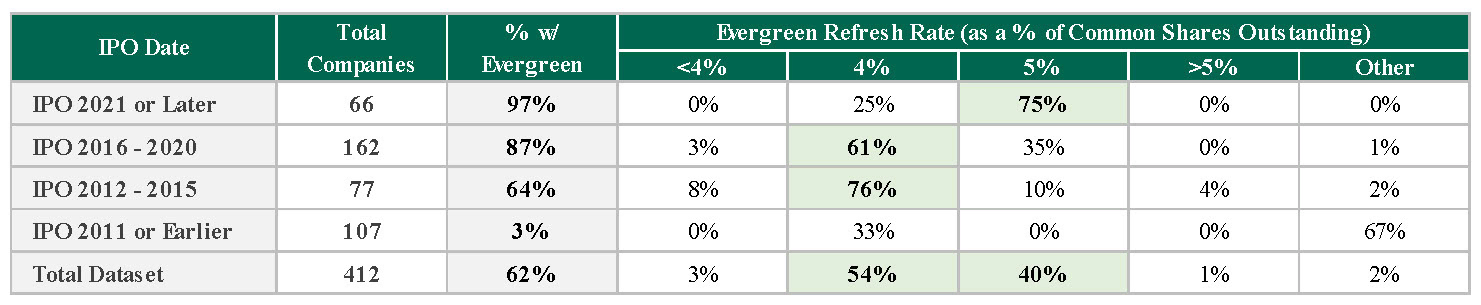
Among companies that went public during 2012–2015, 76% have a 4% evergreen rate and only 10% have a 5% evergreen rate. Among companies that went public during 2016–2020, 61% have a 4% evergreen rate and 35% have a 5% evergreen rate. Among companies that went public from 2021, the majority have 5% evergreen rates. The trend of increases in evergreen rates is likely an additional contributing factor to higher burn rates in 2022.
Although we have observed a meaningful increase in the annual share usage in 2022, we do not expect this trend to continue even with the recent uptick in annual evergreen rates. It is not sustainable for companies to grant equity at burn rates exceeding their respective evergreen rates, as this can overly dilute shareholders and put pressure on limited share pools — which we have already observed.
Available Share Pool — Decreasing in Size
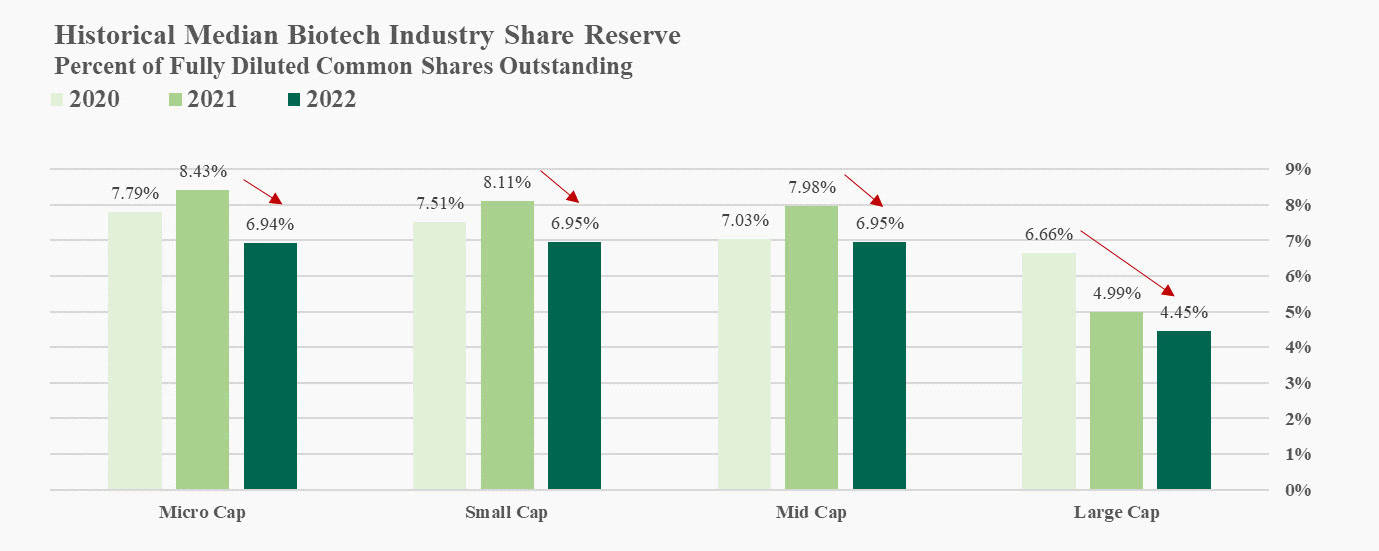
Due to the heavy equity usage in 2022, the size of remaining available share pools has decreased below historical norms. At median, companies tend to start the year with approximately 18–24 months of equity in the reserve (i.e., ~8% for most pre-clinical and clinical companies) or longer for larger companies. However, we observed a shrinkage in available pools that was commensurate with the increase in equity usage (see Figure 6).
Figure 6.
We expect to see an uptick in proxy proposals to shareholders for increased reserves over the next few years, including among companies who may still have several years of life left on their original evergreen refresh provision (which typically last 10 years from IPO).
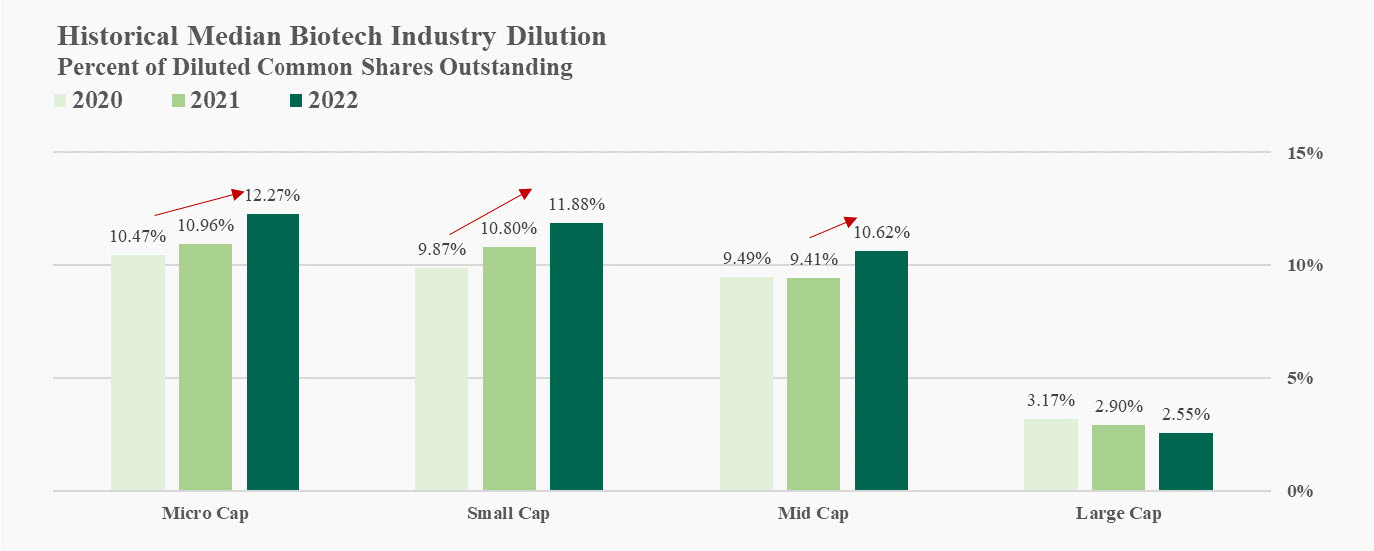
Shareholder Dilution — Increased
Similar to annual burn rates, the amount at which shareholders have been diluted by employee equity grants has increased in 2022 for micro-, small-, and mid-cap companies. As shown below, dilution is represented by the total equity that has been granted and remains outstanding for the employee population and does not include the available share pool (see Figure 7).
Figure 7.
When we review overhang levels, or potential dilution, as it includes the share reserve, we observe levels in the 17–18% range at median and 19–22% range at the 75 th percentile for micro-caps to mid-caps (most companies in this category are pre-clinical and clinical) and prioritize option grants in their LTI mixes. Dilution and overhang levels decrease for large-caps, as these companies typically prioritize full value shares in their LTI mixes (e.g., RSUs) (see Figure 8).
Figure 8.

Conclusion — RSUs are Likely Here to Stay in an Environment with Higher Share Usage, but Not at the Level of 2022
The recent increase in the use of RSUs was in reaction to several factors, starting with the market downturn (e.g., the need to retain talent in a competitive market, desire to conserve cash, and declining perceived value of options), and we anticipate that they will remain a popular vehicle among biotech companies. Nevertheless, we expect that stock options will continue to be the primary equity vehicle of choice.
Market factors have led to higher annual equity usage and shareholder dilution. However, it will not be sustainable for companies to continue to grant equity at the same rate as they did in 2022. As a result, we do not expect to see a continued upward trend in share usage.
As the industry continues to evolve, share delivery and usage will be impacted by external factors and a shifting competitive landscape. Compensation Committees play an important role in administering and making decisions around the equity program — decisions that appropriately account for these external influences while, more importantly, facilitating their company’s internal talent needs and business strategy. More frequent visibility and tracking (e.g., at every quarterly meeting) of the equity program via key usage statistics, share reserve impact, and expected remaining life may need to be the norm for the foreseeable future.
Pay Governance will continue to track these trends; in the coming weeks, we are planning to publish an additional Biotech Industry Viewpoint on retention and severance practices in a volatile market.
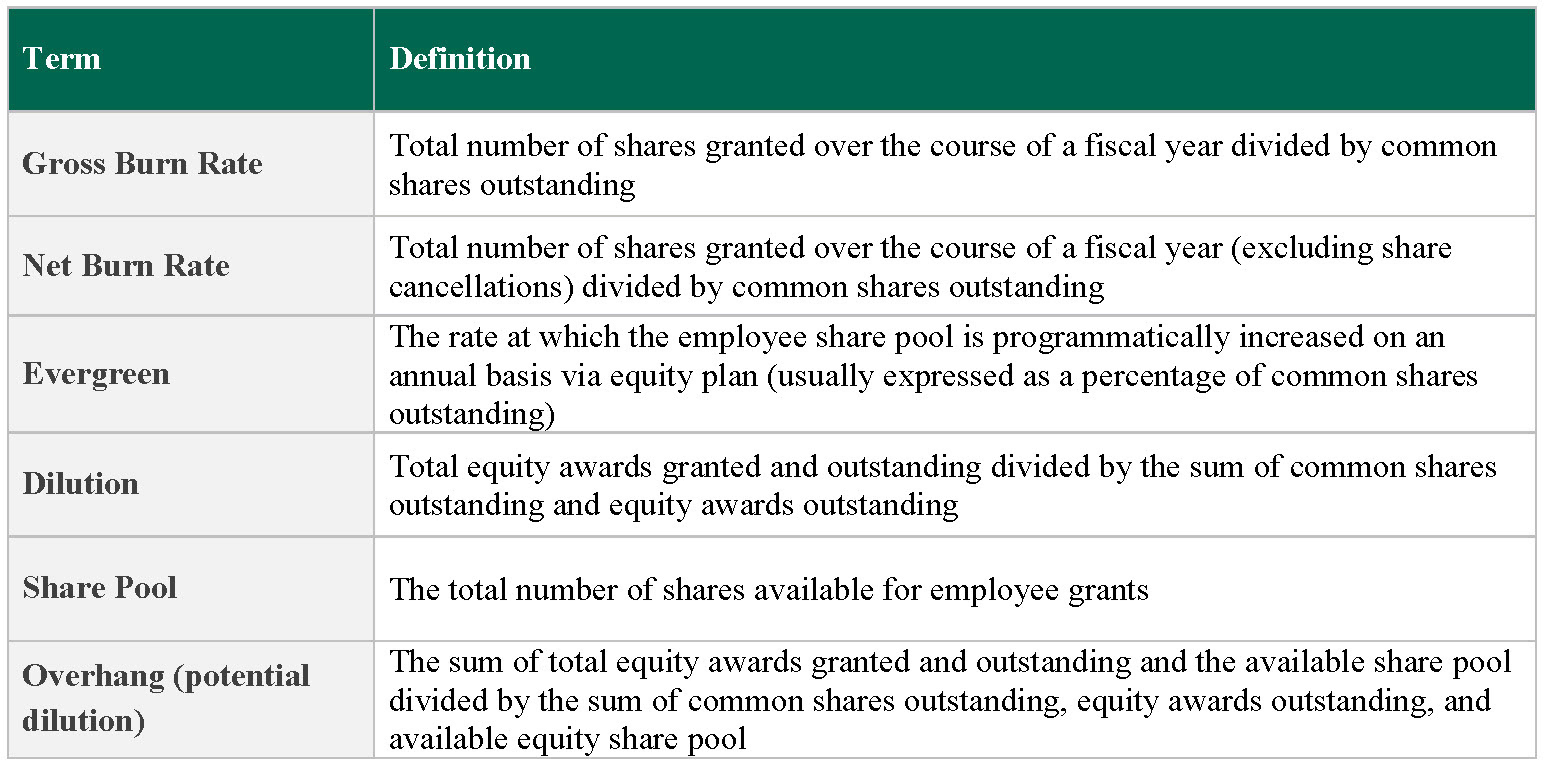
Terminology Table
___________________
1 Pay Governance recognizes the distinction between “biotech” and “pharma” but for simplicity refers to all companies as “biotech” throughout this analysis.
2 As of 12/31/2022.
3 Pay Governance required a minimum 10% of total equity usage for RSUs to be counted in totals. In other words, if RSU usage did not exceed 10% of total shares granted over the course of the year, they were not included as a company that “used RSUs.” The rationale is that many companies use a small portion of RSUs for consultant grants or “one-offs,” and we are looking to capture only those companies that used RSUs as a part of their annual equity program.