Does a Say on Pay Failure Affect Future Share Price Performance?

Key Findings
- Not surprisingly, more than 75% of companies that fail SOP typically underperform the market in the twelve months leading up to their SOP vote.
- After failing SOP, the results of company performance versus the broader market are evenly mixed. Our research indicates that companies failing SOP in 2011 and 2012 experienced at or above-market TSR performance about 50% of the time in the 12- and 24- month period immediately after the failed SOP occurred.
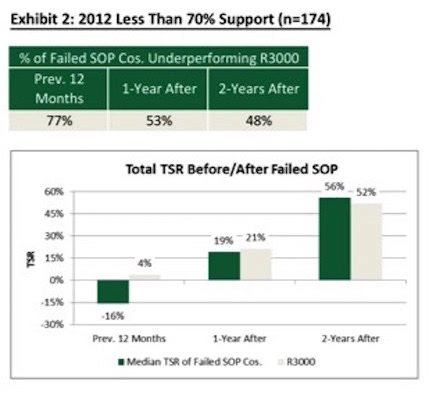
- Companies who received less than 70% support for SOP saw similar results as failed SOP companies, i.e., most underperformed in the 12 months leading up to the SOP vote and approximately 50% performed at or above-market afterwards.
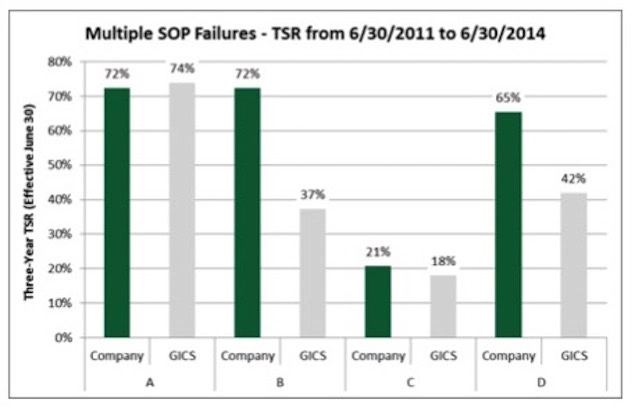
- Companies that have failed SOP multiple times (primarily small- to mid-cap companies) actually outperformed their industry peers on a go-forward basis in a majority of cases.
Introduction
As companies approach the upcoming proxy season, Say on Pay (SOP) once again becomes top of mind for Compensation Committees and corporate management. Over the past 4 years since SOP proposals became mandatory under Dodd-Frank, shareholders have continued to show overwhelming support for executive pay packages despite continued criticism by media and other outlets. Since 2011, only 2% of companies annually have failed SOP, the vast majority of which were due to pay-for-performance concerns cited by proxy advisory firms such as Institutional Shareholder Services (ISS) and Glass Lewis.
While an underperforming company coupled with high CEO pay can lead to investor dissatisfaction with the pay program, we wanted to study the subsequent performance of these failed SOP companies to determine if failing SOP actually leads to underperformance in future years. The key question underlying our research has been, “does a SOP failure affect a company’s future share price performance?” Our research indicates that a failed SOP vote (or sub-70% SOP support) is not indicative of systemic TSR underperformance versus the market. In fact, in some cases, companies that fail SOP outperform the market over the subsequent years. In addition, our research contradicts the opinion of some executive compensation critics that weak corporate governance policies are a leading indicator of damaging returns to shareholders.
Background and 2014 Say-on-Pay Results
As we start a New Year and approach the 2015 proxy season, we provide some highlights from 2014. Seventy-eight percent (78%) of companies within the Russell 3000 Index (R3000) have achieved greater than 90% support for their SOP proposals, a level consistent with support levels seen since 2011. In addition, only 2% of companies have failed to obtain majority support for their SOP proposals in 2014, a level also consistent with previous years’ results.
Companies failing SOP typically underperform market leading up to SOP vote
We studied companies failing SOP in 2011 (n=34) and 2012 (n=53) to compare how their returns fared against the market in the twelve months leading up to their failed SOP vote. The results were fairly predictable in that most companies underperformed the market leading up to their annual meeting (for consistency purposes we used a June 30th measurement date). In 2011, 76% of those companies who ended up failing SOP underperformed the broader market (Russell 3000) in the twelve months prior to their annual meeting. We evaluated company performance versus the R3000 because it is a comprehensive barometer of the investable U.S. equity market and is the subset of companies tracked by ISS’ Voting Analytics Database. All of the failed SOP companies referenced in this report are R3000 constituents. The outcome was similar for the companies failing SOP in 2012, with 81% of companies underperforming the market leading up to their annual meeting. This result is hardly surprising: lagging company performance is a primary factor for investor dissatisfaction when evaluating pay-for-performance alignment in connection with a SOP vote.

Subsequent performance after a failed SOP vote is mixed versus broader market
Given the lagging returns versus the broader market in the months leading up to most failed SOP votes, we researched subsequent TSR performance to determine whether the failed votes seem to impact future share price performance. The results are decidedly mixed: companies failing SOP in 2011 underperformed the broader market approximately 55% to 60% of the time during the following 12- and 24-month timeframes. The results are even more striking for those companies that failed in 2012: less than half underperformed the market in the 12- and 24-month timeframes after the failed SOP vote occurred. These findings suggest that failing SOP does not have a meaningful impact, if any, on future share price performance for a company. It also suggests a rebound situation may have been in effect; these companies might have underperformed the market in advance of failing SOP, but the companies themselves were not necessarily damaged businesses.

Broader sample of companies with low SOP vote support also experienced similar results
Acknowledging that studying a group of companies with fewer than 100 cases can lead to issues stemming from small sample sizes, we reviewed the TSR performance for those companies that received less than 70% support (n=340) to determine whether similar outcomes existed. Our research indicates that companies receiving less than 70% support for SOP (a threshold commonly viewed as indicative of significant investor dissatisfaction with the pay program) experienced similar results to those that failed SOP. On average, they underperformed the market in the 12 months prior to the annual meeting, but the results are mixed when measuring performance subsequent to the failed SOP vote: approximately 50% to 60% underperformed the market in the 12- and 24-month timeframes after the low SOP vote occurred (see Appendix A for details).
Serial SOP-failing companies actually outperformed industry peers in a majority of cases
For serial SOP-failing companies (defined herein as companies failing SOP three times or more beginning in 2011), it would be reasonable to assume that consistently low returns to shareholders would be a leading cause for the failed votes. However, our research indicates otherwise. In three out of the four cases, TSR performance for the failed companies outpaced industry peer performance (defined as the 8-digit GICS sub-industry classification) over the subsequent three-year period (in some cases by a wide margin). If sustained underperformance isn’t the primary cause for low SOP support, then it’s likely that excessive CEO pay and/or poor pay practices are. While we acknowledge that the sample size for this research is very small, the findings do contradict the opinion of some executive compensation critics that weak corporate governance policies are a leading indicator of damaging returns to shareholders.
It is interesting to note that the multiple SOP failures have occurred primarily at small- to mid-cap companies. It’s possible that the compensation committees at these smaller companies faced unique circumstances that made it challenging to respond to the failed SOP votes. However, for most companies, the optics of repeatedly failing SOP and having shareholder dissent over pay programs are too damaging for the companies, board members and executives to accept without making significant changes to company pay programs and policies.
Conclusion
These findings suggest that in the early stages of the SOP era, failing to obtain majority support for SOP is not a strong leading indicator of company performance over time. At best, the results are mixed, i.e., companies that fail SOP sometimes underperform over the long-term, and sometimes they outperform. However, there is no clear evidence that failing SOP has a direct, sustained link to shareholder returns.
Appendix A: