Evaluating the ISS Test of CEO Pay-for-Performance for Say-on-Pay Votes

EXECUTIVE SUMMARY
1. Our new research indicates that many large companies may receive high concern or medium concern ratings for pay-for-performance alignment and in more extreme cases, against recommendations for Say-on-Pay (SOP) votes from Institutional Shareholder Services (ISS) despite the reality that, when properly measured, their pay programs exhibit true alignment. This may adversely affect the outcomes of Say-on-Pay votes.
2. There are many ways to measure CEO pay and its alignment with multi-year company total shareholder return (TSR). Based upon our research, we believe that realizable pay is the preferable metric for this comparison. Value delivered not value granted should be aligned with performance. This is the distinction that boards, in designing pay programs, and executives, in receiving annual grants of pay opportunity, expect.
3. Studying CEO pay at large companies, we tested pay/performance alignment across all industries in two ways: (i) using realizable pay and (ii) using pay opportunity in a manner similar to the new ISS Relative Degree of Alignment (RDA) test. Using realizable pay, we found that more than 91% of large public companies have pay programs that are aligned with TSR .
4. Using both tests, approximately 86% of the companies examined exhibited the same results regarding alignment versus misalignment. However, our comparison of the two tests revealed:
- False negatives. We found that more than 10%of the companies for which the ISS opportunity-based test found misalignment (high pay opportunity with low TSR) had realizable pay that was actually aligned with performance. Neither board members nor executives expect pay opportunity to be aligned with TSR.
- False positives. We found that less than 4%of the companies that the ISS test found to have achieved alignment actually had high realizable pay and low TSR. This however, is a very small group of companies with particular circumstances.
5. We found that in both tests, the level of pay opportunity relative to market levels plays a role in pay/performance alignment results; companies shown to be of high concern were also the group of companies with the highest pay opportunity.
6. Further, the companies with false negatives had extremely low relative TSR, which resulted in low realizable pay. Yet, since the ISS test measures pay opportunity but not realizable pay, it incorrectly indicated pay/performance misalignment. Thus, the ISS test results are often found to be a mystery at best and a frustrating disappointment at worst for the boards of these companies.
7. Lastly, companies that showed poor alignment regarding realizable pay typically had a steep dip in stock price from 2008 to 2009, with only partial recovery by 2010. However, stock grants made in 2009 had a relatively high value of realizable pay (53% of three-year total compensation), which increased amounts for three-year total realizable pay even though overall alignment of pay to TSR for the three-year period was lacking.
INTRODUCTION
Currently, thousands of companies are busy finalizing their 2012 proxy statements. Proxy advisors — such as ISS and Glass Lewis — are preparing to make their Say-on-Pay recommendations, and shareholders will be casting their votes. The single most powerful determinant of how positive or negative the outcomes of these votes will be is the overall alignment of CEO pay to company performance. Boards of directors, management teams, and advisors have worked hard to ensure as much alignment as possible and to clearly demonstrate their pay-for-performance orientation in proxy statements.
And yet, despite the importance of pay/performance alignment, there is no universally agreed-upon test to determine its existence or strength. There is general agreement that TSR is, if not the right performance metric, certainly the most visible and important to shareholders, but there is substantial disagreement over how best to measure CEO pay. Some analysts use the total compensation figure from the proxy summary compensation table (SCT), which includes both prior-year cash payouts and “new pay” in the form of the grant-date value of stock and stock options. Others start with the SCT total compensation figure and strip out indirect pay such as pension values and non-qualified deferred compensation. Yet others modify the SCT number using proprietary calculations. And finally, some use realized pay values. Each method has its pros and cons, and each can produce significantly different results.
However, more and more companies are segregating and seeking to communicate the often very different figures of pay target or opportunity from realizable pay. For decades, companies have used opportunity for setting pay targets that are typically based on market data, internal equity, and individual performance. The purpose of the pay target is to provide a powerful stock price performance. As a result, we think that while not perfect, a direct comparison of realizable pay to company performance during set periods has the capacity to measure performance on a relative basis and allows for a direct test of what boards intended.
As we have stated previously, Pay Governance research shows that prospective pay opportunity generally is not aligned with recent retrospective TSR although realizable pay is strongly aligned with TSR (see the Viewpoint, CEOs Are Paid for Performance: Using Realizable Pay to Demonstrate Alignment with Total Shareholder Return). We have found that when analyzing compensation systems using realizable pay, more than 90% of companies have compensation that is aligned with shareholder returns. Our unique pay-for-performance methodology allows us to test whether pay/performance alignment exists in the form that compensation committees intended and whether plans motivate executive teams to perform. Unsurprisingly, we have found that generally speaking, the highest-performing companies have the highest realizable pay, and the lowest performers have the lowest realizable pay. We believe that in considering their SOP votes, this is the alignment that should be of primary interest to shareholders.
However, proxy advisors generally prefer to use a variant of pay opportunity for this test. This is quite disconcerting to directors whose companies fail the ISS test because of low or negative TSR when they actually had true pay/performance alignment. Although executive teams understand that their low realizable pay was inevitable because of weak performance, they find it extremely disappointing to then receive negative SOP votes because shareholders mistakenly believe that pay and performance are not aligned.
USING REALIZABLE PAY (PAY GOVERNANCE) AND PAY OPPORTUNITY (ISS) IN PAY-FOR-PERFORMANCE TESTS
When Pay Governance conducts its pay-for-performance assessment for clients, we utilize a methodology that includes a comparison of (i) the competitive positioning (percentile rank) of realizable pay relative to that of peers to (ii) the competitive positioning (percentile rank) of company performance (TSR) relative to peers, over a given multi-year time period.
In the release of its 2012 Policy Guidelines, ISS appeared to make many thoughtful adjustments and enhancements in redefining the manner in which it will evaluate pay-for-performance alignment. In reviewing 2012 proxy statements, the proxy advisory service will use a three-pronged quantitative approach to measure pay/performance alignment:
- Relative Degree of Alignment (RDA). This relative measure compares the percentile ranks of a company’s CEO pay and TSR performance relative to those of companies in the same industry and size over one- and three-year periods.
- Multiple of Median (MOM). This relative measure expresses the prior year’s CEO pay as a multiple of the median pay of its comparison group for the same period.
- Pay-TSR Alignment (PTA). This absolute measure compares trends of the CEO’s annual pay and the value of an investment in the company over the prior five-year period.
However, despite the more rigorous methodology and analyses adopted by ISS, they will continue using the same pay metric that it has used in the past, which combines ISS-calculated pay opportunity values with other proxy-disclosed pay values.
While ISS pay metrics are significantly different than ours, the methodologies used in its RDA test and our realizable-pay-for-performance studies are similar. Using CEO pay and company TSR data for a group of 373 companies, we compared the results of the two tests to identify companies with pay (opportunity and/or realizable) that is aligned or misaligned with company performance and to identify levels of concern.
METHODOLOGY
Our study uses three years of CEO pay data (from Equilar) from 373 S&P 500 companies with median revenues of $8 billion and a market capitalization of $12 billion that had filed 2011 proxies by mid-June. To simulate the ISS RDA test, we subtracted the percentile ranking (relative to the entire group of 373 companies) of each company’s three-year CEO total direct compensation (TDC) opportunity from the percentile ranking of the same company’s three-year TSR. We then compared this difference to the same thresholds that ISS set for each of the following levels of concern over pay/performance alignment:
- High concern: The difference is between -50 and -100 (i.e., pay and performance are highly misaligned).
- Medium concern: The difference is between -50 and -30 (i.e., pay and performance are somewhat misaligned).
- Low concern: The difference is between -30 and +100 (i.e., pay and performance are aligned).
We then performed the same analyses using realizable TDC. Comparing the results from both tests allows us to identify situations for which the two methodologies are consistent and, more interestingly, instances where there is a divergence between ISS’ approach (using pay opportunity) and ours (using realizable pay) leading to potential pitfalls for companies:
- False negatives: Companies that the ISS RDA test finds to have misaligned pay and performance but show good alignment when realizable pay is considered
- False positives: Companies that the ISS RDA test finds to have good pay/performance alignment but have realizable pay that is actually misaligned with company performance
FINDINGS
Table 1 below shows the number of companies that fall into each level of concern under both the ISS test and our realizable pay test. We found that 257 of the 373 companies reviewed (69%) have realizable TDC and TDC opportunities that are both well aligned with company TSR performance (i.e., high pay and high performance or low pay and low performance). The table also shows the median SOP “for” vote percentages for each level of concern in 2011. “For” votes decrease as the level of concern increases, as the level of pay/performance alignment decreases, suggesting that shareholders react favorably to pay programs that are shown to be better aligned with performance. Nevertheless, all cohorts had relatively positive outcomes, indicating broad shareholder support.
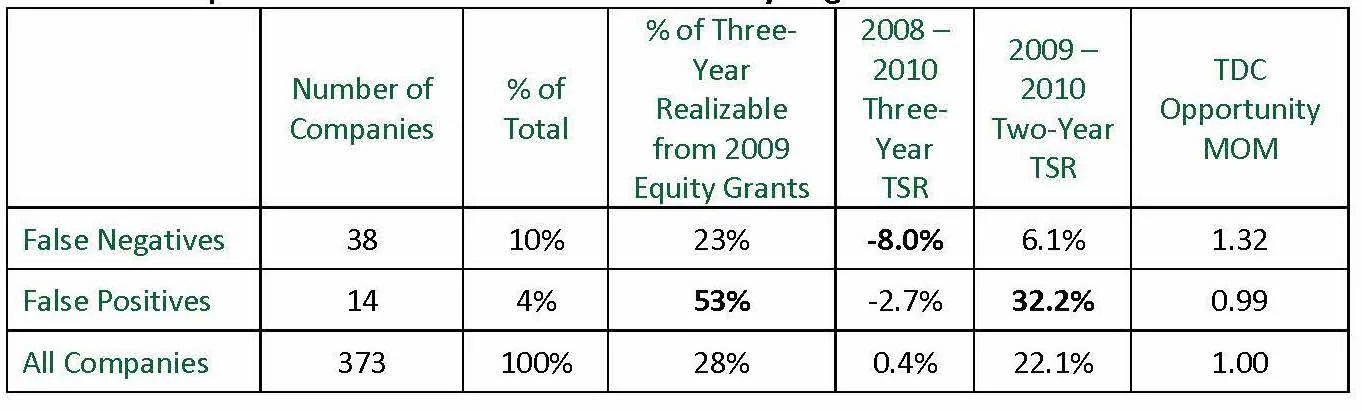
TABLE 1: Number of Companies in Each Level of Concern: CEO 3-Year TDC vs. 3-Year TSR

TABLE 2: Comparison of RDA Test and Realizable Pay Alignment Test
There are a number of possible program design and policy reasons for this outcome, all of which are overlooked by the ISS RDA test. These include:
- A high concentration of equity in total direct compensation
- A high concentration of stock options in long-term incentive values
- The presence of well-defined, challenging performance goals
- Above-median pay opportunity that is still in a reasonably competitive range (e.g., 60th or 65th percentile)
- Incentive-plan financial metrics that are well-correlated with TSR4
- After-the-fact adjustments to incentive plan payouts (either via compensation committee discretion or payout multipliers based on TSR)
One factor at play in the false-positive companies, is the portion of total three-year realizable pay that comes from 2009 equity awards (53%) and the high TSR experienced from the time of these grants through 2010 (32.2% vs. 6.1% for false negatives). This suggests that these companies had a major dip in stock price in 2009 and that, as the stock prices recovered, equity granted in 2009 became much higher in realizable pay. The result was three-year realizable pay that was misaligned with overall three-year TSR while the two-year period from 2009 to 2010, with high (+32.2%) TSR, yielded good alignment. We consider this to be a valid explanation, which further diminishes the importance of the false positives.
These companies also granted pay opportunities commensurate with the overall median (suggested by a MOM of 0.99), compared with pay opportunities approaching the 75th percentile for the false negative category (MOM = 1.32).
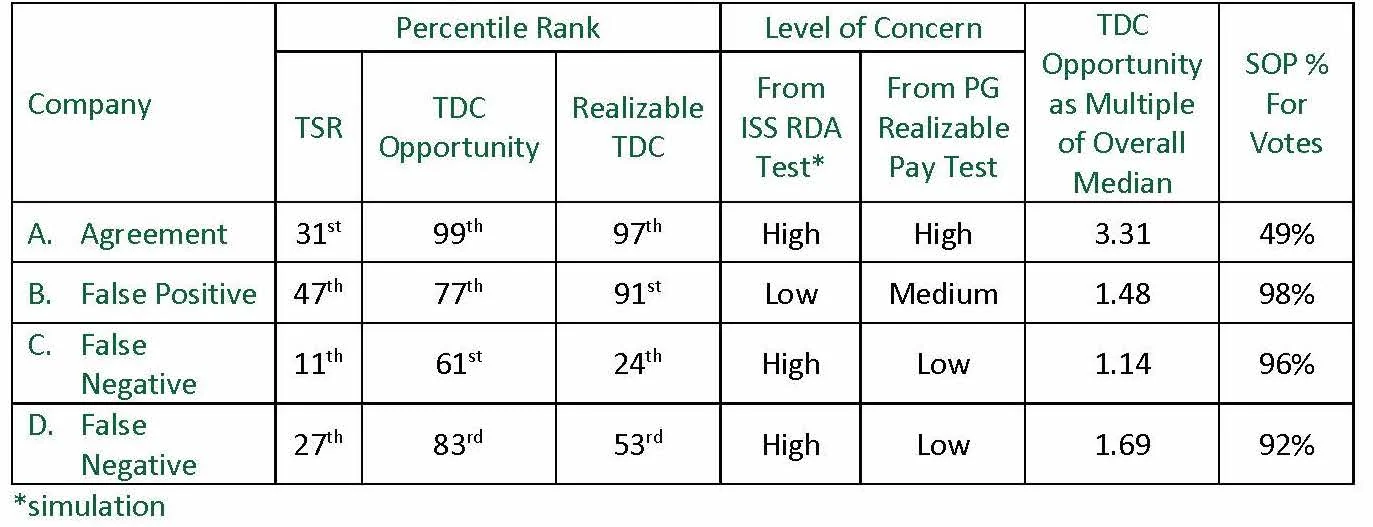
To highlight some of the differences between the two tests on a company-specific level, in Table 3 we provide anonymous data on four of the companies in our study. Significantly, only Company A, for which the two tests agreed regarding high concern, experienced a low, failing SOP vote. Also of note is Company C. Despite relatively low TSR performance (11th percentile), an above-median pay opportunity (61st percentile), and a high concern rating from the ISS RDA test, this company had realizable pay that is aligned with TSR performance and received 96% support from shareholders in its SOP vote.
Pay/performance alignment will continue to be the paramount concern of compensation committees designing executive pay packages and of shareholders who are asked to vote on them. And now more than ever, committees and management teams must continually ensure this alignment exists by periodically conducting analyses, using a study such as Pay Governance’s assessment. While our research summarized here draws from a broad group of large companies, we have conducted many of these studies for clients, applying relative pay/performance comparisons within their industry peer sets.
There are many potential policies available to boards pay opportunity, performance goals, equity mix, etc. that can help balance the goals of motivating executive teams and creating/maintaining excellent corporate governance. In our experience, most boards are highly thoughtful in selecting and designing these policies. Communicating the results of these studies and policies in the context of your company’s overall pay-for-performance story in the CD&A can help shareholders cast appropriate SOP votes.