What Shareholders Can Learn from the SEC’s New Pay Versus Performance Disclosure

Pay Governance has reviewed the Pay Versus Performance (PVP) disclosures of 160 S&P 500 companies that filed their annual proxies as of March 31, 2023 based on data collected by ESGAUGE, to determine if the PVP information can be used to evaluate the relationship of pay and performance. We have also analyzed the main factors driving the amount of, and changes in, compensation actually paid (CAP). This Viewpoint is our second analytical review of the 2023 PVP disclosures. (Does the SEC’s New PVP Disclosure Facilitate Shareholders’ Assessment of Pay-for-Performance Alignment?)
The proxy advisory firms and some institutional investors have confirmed the PVP disclosure will not be used for evaluating Say on Pay proposals this year. However, companies and compensation committees need to understand how their compensation programs align with performance and how investors and other stakeholders may interpret such alignment through the PVP disclosures.
This Viewpoint focuses on three questions and key takeaways:
1. What are the components that make up CAP dollar values, and how do they differ from the Summary Compensation Table (SCT) dollar values?
2. How do year-over-year changes in CAP dollar values compare to changes in total shareholder return (TSR)?
3. What are the key drivers in the year-over-year changes in CAP dollar values (including why the dollar values of CAP and changes in CAP dollar values are different)?
We explore each of these questions in the sections below.
Key Findings1
Based on our analysis, there are several key findings that shareholders and companies may find of interest, including:
- The new PVP disclosure is supportive of the current executive compensation framework used by most companies, as compensation outcomes are directionally aligned with shareholders’ interests. It also justifies their significant support for Say on Pay during the Say on Pay era these past 12 (going on 13) years.
- The fair value2 of the current year’s equity award has the greatest impact on the CAP absolute dollar amount.
- Higher performing companies (as measured by TSR) reported significantly higher CAP values than lower performing companies for each of the last three years (2020-2022).
- As explicitly expected by the SEC, CAP can be very volatile between years due to stock price changes and adjustments to expected performance outcomes.
- Changes in SCT total compensation, on the other hand, tend to move within a narrow range because the biggest drivers of the change relate to the current year’s annual incentive, a relatively small portion of total compensation, and changes in the grant date value of the current year’s equity awards, which are generally conservative.
Discussion
1. What are the components that make up CAP dollar values and how do they differ from the SCT dollar values?
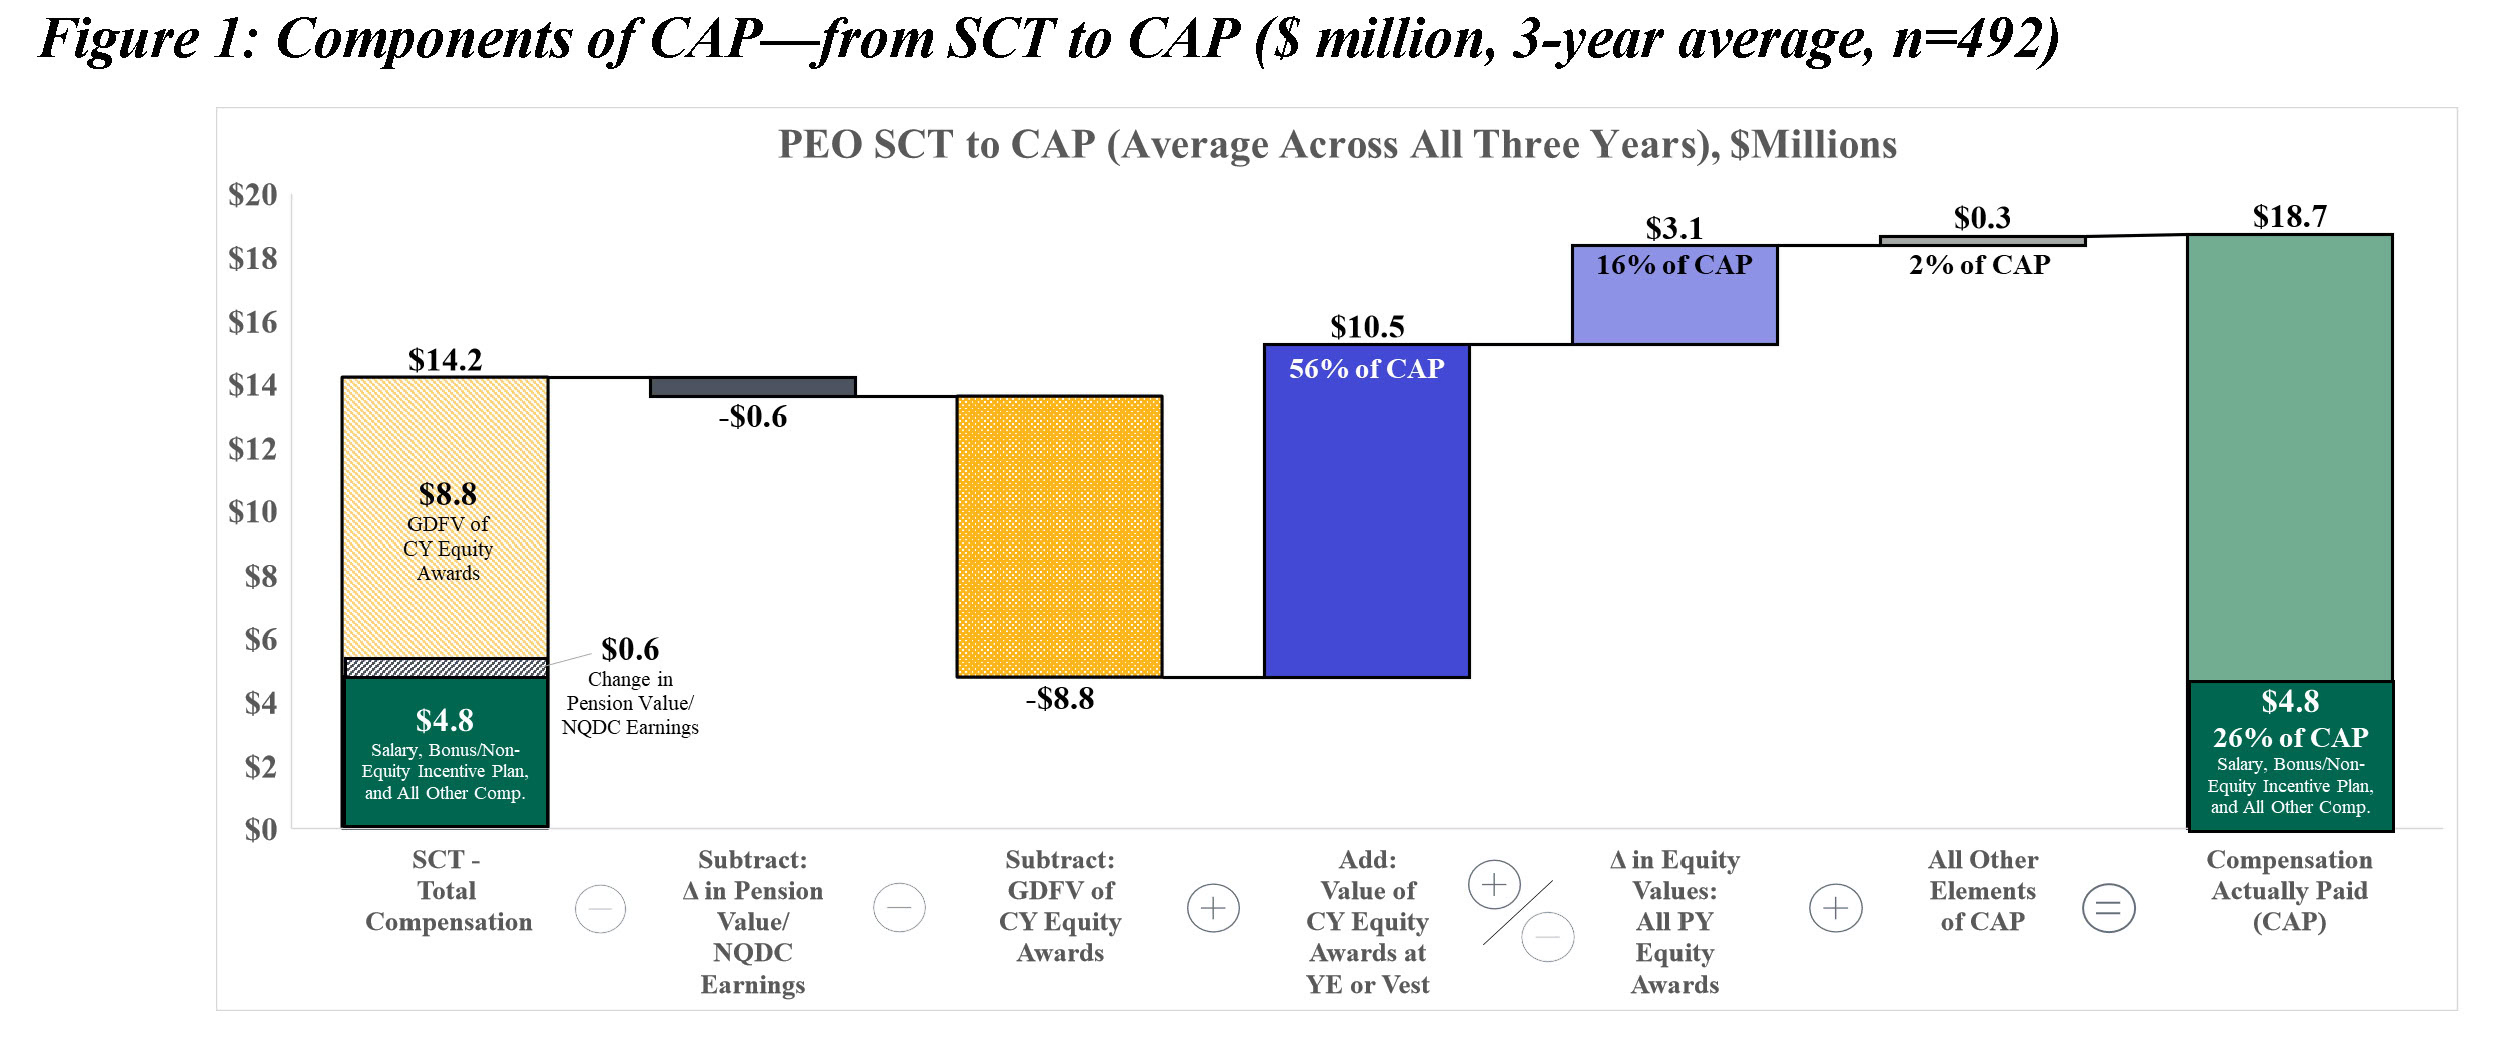
Figure 1 shows that the largest component of CAP dollar values over the last three years, on average, was the fair value of equity awards granted during the most recently completed fiscal year (56% of CAP). However, given the volatility of stock prices during the last three years, the portion of CAP attributable to the change in value for prior years’ equity awards varied meaningfully. For example:
- In 2021, when average TSR increased 32%, the change in value of prior years’ equity awards was 39% of CAP.
- In 2020, when average TSR increased a more modest 7%, the change in value for prior years’ equity awards was 13% of CAP.
Figure 1 reconciles the 3-year average SCT compensation to the 3-year average CAP amount based on the SEC’s required adjustments.
- Salary, annual incentive, and other compensation, which are the same amount for SCT and CAP purposes, were about 26% of CAP during this period.
- Equity values for CAP purposes were the remaining amount, or about 74% of total CAP values during the 3-year period.
2. How do year-over-year changes in CAP dollar values compare to changes in TSR?
As shown in Figure 2 below, the relationship of CAP and TSR for the full 160 company sample (middle line with green boxes) appears to be closely aligned (i.e., better TSR equals higher CAP and vice versa). In addition, this relationship continues when the companies are separated into above and below median performing companies for each year.
- In 2020, the above median performing companies reported average CAP of $21.1 million and TSR of 28% compared to CAP of $10.5 million and TSR of -15% for below median performers.
- In 2021, the above median performing companies reported average CAP of $34.0 million and an increase in TSR of 52% compared to CAP of $18.0 million and TSR of 11% for below median performers.
- In 2022, the above median performing companies reported average CAP of $23.4 million and TSR of 17% compared to CAP of $5.0 million and TSR of -26% for below median performers.
The absolute differences in average CAP between the above and below median TSR performers are large:
- 2020: $21.1 million versus $10.5 million
- 2021: $34.0 million versus $18.0 million
- 2022: $23.4 million versus $5.0 million

3. What are the key drivers in the year-over-year changes in CAP dollar values (including why the dollar values of CAP and changes in CAP dollar values are different) ?
As previously shown in Figure 1, under typical circumstances, the major driver of the absolute CAP dollar amount is the fair value of the current year’s equity award. The impact of the change in fair value of the prior years’ equity awards is an important but smaller portion of CAP. However, when examining the changes in CAP dollars between years, the change in the fair value of prior years’ awards tends to have the most significant impact on CAP. This is due to the leverage of a potentially large cumulative number of shares inherent in having all, or portions of, 3-4 prior years’ awards included in the calculation (as shown in Figure 3 below). The effect of prior year awards can be especially pronounced for companies who made large one-time grants in prior years, such as during the COVID-19 pandemic in 2020 or 2021.
In Figure 3 below, we disaggregated the key elements of the change in CAP dollars in 2022 from 2021 and 2021 from 2020. This analysis shows 74% of the 2022 CAP change and 58% of the 2021 CAP change were attributable to the change in the fair value of prior years’ equity awards. As previously noted, this is due to the leverage effect of measuring the change in stock price (and estimated performance outcomes) for all or portions of 3-4 years of prior year equity awards. Please note that none of the changes in value of equity awards either based on stock price or performance are captured in the SCT calculations.
Figure 3 also shows the change in the fair value of the current year’s equity awards accounted for 25% and 32% of the 2022 and 2021 change in CAP values, respectively, with some differentiation between the above and below median TSR performing companies. Contrast this with the impact current year equity awards have on the absolute CAP dollar amount in Figure 1, where such awards accounted for 56% of the absolute CAP amount.
The change in salary, annual incentives, and other compensation (pension adjustments, dividends on unvested shares, and forfeitures) had a modest impact on the change in CAP between years.
- Interestingly, the change in SCT total compensation was 3% in 2022 and 7% in 2021, compared to changes in the reported CAP amounts of -45% and +65%, respectively — as noted previously, no changes in equity values, either for past or current year grants, are captured by the SCT.
- This outcome suggests that while the new PVP disclosure — especially the calculation of CAP — is not perfect, it is a better measure than using the grant date value of equity awards to evaluate pay-for- performance and shareholder alignment.

Conclusion, Implications and Considerations
Pay Governance’s analysis shows the new PVP disclosure supports the current executive compensation framework used by most companies, as compensation outcomes are directionally aligned with shareholders’ interests. It also reinforces shareholder support for Say on Pay since its 2011 inception. In general, we do not believe companies should or will make program design changes to try to improve their PVP disclosure. However, we do recommend management and Compensation Committees consider the questions investors and other stakeholders might ask at the next shareholders’ meeting based on the new disclosure. These might include:
- Is the relationship of CAP and TSR sufficiently aligned?
- Are the relationships of CAP to the other financial performance measures included in the PVP table (GAAP net income and the company selected measure) sufficiently aligned, and if not, are the reasons explainable?
- Is the company’s TSR in line with its peers?
- Is the absolute quantum of CAP reasonable?
- Are the year-over-year changes in CAP driven by the company’s performance?
- Is the use of grant date fair values — as presented in the SCT and used as the primary pay-for-performance test by the proxy advisors, or the equity values as presented in the PVP disclosure — the best way to evaluate pay-for-performance? Or is some type of realizable/realized pay, that considers expected (realizable pay, similar to PVP disclosures) or actually realized pay outcomes, a better approach? Pay Governance plans on preparing a detailed analysis and the pros and cons of each of these different methodologies later this year.
We have shown the PVP disclosures generally indicate a strong alignment of PVP for most companies. But for those companies where this may not be the case, there may be some ways to identify the potential sources of the misalignment, including:
- Is the incentive payout/performance leverage appropriate? If performance stock unit (PSU) estimates and payouts fluctuate materially between years, it is possible the performance range between threshold and maximum performance may be too narrow. A narrow performance range could cause small changes in expected performance to have a large impact on projected payouts.
- Does the program design adjust the target incentive opportunity (e.g., grant date value of equity awards) based on performance in prior year(s)? This practice is relatively common in the financial services industry, but not elsewhere.
- Does the pay mix impact CAP in unintended ways (e.g., not enough emphasis on equity incentives)? A company which provides 80% of total compensation as equity would likely have a more variable and volatile CAP outcome than a company that provides only 50% of total compensation as equity. The form of equity (e.g., stock options, restricted stock, PSUs) would also likely have an impact.
- Does the use of Monte-Carlo or Black-Scholes valuations overstate the value of unvested equity relative to current stock price?
In addition, if there is some degree of perceived misalignment, additional narrative should be considered to help describe the relationship of CAP to TSR, GAAP net income, and the company-selected measure in the PVP table footnotes. Companies may also want to consider adding supplemental 3-year performance measures and results to the PVP table, as most PSUs vest based on 3 years’ performance and the SEC only allows the tabular reporting of the current year’s performance.
It will also be important to see how investors and other stakeholders use this information in this inaugural year and how it might form voting policies or open new avenues of activism in future years. Equally important will be what insights, commentary, or additional guidance — if any — the SEC might provide after the proxy season with regard to the PVP disclosure.
_________________________________