Incentive Design Tailored to Companies Subject to Economic Cyclicality and/or Commodity Exposure

Introduction
The title of this Viewpoint references two issues that can wreak havoc on company incentive plans. What does “wreak havoc” mean in this context? It means incentive results or payouts that fluctuate significantly, or as many company executives and directors have told us, “Our payouts reflect compensation extremes. We are subject to the ‘boom or bust’ of the cycle.”
This situation can have a profound impact on employee morale and a company’s ability to attract and retain talent. Establishing incentive plan performance goals that reflect an appropriate level of rigor is a daunting task. Are annual business plans or longer-term forecasts developed at or near the peak of the economic or commodity cycle or at the lower trough? The impact of this timing can result in performance goals that are either overly challenging (and, in some cases, unachievable) or quite the opposite, lacking rigor and just plain too easy in hindsight.
The impact of this timing is especially pronounced when establishing goals for performance-based equity incentives, whose measurement period is most often 3 years in length. An unanticipated sharp drop-off in economic activity or a steep decline in commodity prices at any time during the 3-year cycle can negatively impact (or eliminate) payouts under these plans, resulting in a “hole” in compensation in the year of payout. This situation does not bode well for either retaining highly skilled and mobile employees or attracting necessary skill sets. So, what can be done in anticipation of these situations, which arguably are based on events or activities that fall outside of management’s control?
While nearly all companies are subject to the whims of economic activity and ” to some degree ” commodity prices, others are impacted on a much more significant level. To illustrate this point and establish the basis for our analysis, we examined two separate groups of companies that reside mainly in the industrial and energy sectors.
- “Less cyclical” company group” 66 companies with median 5-year beta 1 of 0.93 that provide a baseline of contemporary incentive design among less cyclical companies.
- “Cyclical” company group” 66 companies with median 5-year beta of 1.72 (companies with high betas and within cyclical industries) that were selected to identify the practices used by highly cyclical companies.
When analyzing incentive practices of the “less cyclical” versus the “cyclical” companies, we found several differences in incentive practice and design. When coupled with our own experience of addressing cyclicality, the approaches discussed below provide a variety of methods to soften the compensation extremes brought on by cyclicality without jeopardizing the alignment of executive pay and company performance.
Annual Incentive Plan
Performance Metric Considerations
Cyclical companies tend to use more metrics than less cyclical companies to measure performance under their annual incentive plan. Based on our research and consulting experience, cyclical companies are more likely to use four, five, or even more performance metrics than less cyclical companies. Consistent with the theme of mitigating compensation extremes in the pay system, the use of a greater number of metrics reduces the focus on one or two metrics and therefore reduces the likelihood of a zero or maximum bonus payout. In addition, the use of non-financial measures ” such as operational, safety, and environmental metrics ” is more common among cyclical companies. These metrics are often assigned to a “strategic” category of metrics (applicable to all executives) or within an individual performance category (applicable to individual executives). The weighting assigned to the non-financial metrics is often higher among cyclical companies than in less cyclical companies. The rationale for using more performance metrics and non-financial performance metrics in general includes the following:
Performance Range Considerations
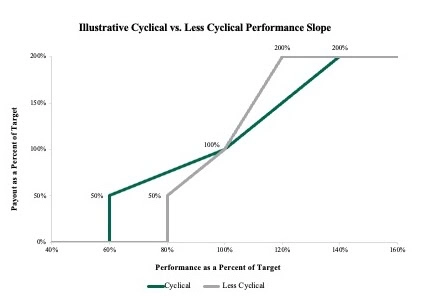
Cyclical companies typically use wider performance ranges to accommodate swings in commodity prices and economic volatility, thus reducing the frequency of maximum or zero payouts. For example, a cyclical company might use a performance range for an earnings-based metric that establishes threshold performance at 60% to 70% of targeted performance and maximum performance at 130% to 140% of targeted performance. In contrast, less cyclical companies are more likely to use a “traditional” performance range for earnings-based metrics with threshold performance set at 80% of targeted performance and maximum performance set at 120% of targeted performance. Thus, management must outperform the target goal to a greater degree to merit a maximum payout, while greater forgiveness is provided on the downside if target results are not achieved.
The rationale for using wider performance ranges includes the following:
Performance Measurement Considerations
Truly cyclical companies understand the uncertainties related to economic and commodity price assumptions that drive annual and long-term business plans. These business plans most often serve as the basis for establishing incentive performance goals. Further, the COVID pandemic and its subsequent recovery created an unusual whipsaw in the business environment in 2020 and 2021, prompting some companies to experiment with new incentive design approaches. For some companies, these methodologies have become a standard component of ongoing practice.
The use of partial year performance goals provides an alternative to establishing annual goals when the business outlook for the full year is uncertain. This typically involves the implementation of two shortened performance periods, or “First Half” and “Second Half” goals, to mitigate the uncertainty of setting full-year goals while still maintaining a single annual payout. For example, a calendar year-end company would measure performance for the period from January 1 st through June 30 th and then measure performance for the period from July 1 st through December 31st.
This allows the Compensation Committee to evaluate more current information about the company’s prospects when establishing goals for the upcoming 6-month period. While performance is evaluated at the end of the first 6-month period and then independently at the end of the second 6-month period, payouts are almost always made after the end of the year, consistent with annual incentive plans based on full-year goal setting.
Performance Goal Setting Considerations
An alternative approach is the use of a “target performance range.” Under this method, a company establishes a range around the target performance goal reflecting insights regarding expected commodity price volatility or economic performance. The following example illustrates this approach for a company that uses Earnings Before Interest, Taxes, Depreciation and Amortization (EBITDA) as a performance metric, which is highly sensitive to a commodity price. The company believes that the commodity price could fluctuate between 90% and 110% of the price assumption selected for the annual business plan that is used to establish the target EBITDA performance goal. Assuming the use of a wider performance range (60% to 140% of target for threshold and maximum performance) the target range would be illustrated as follows:
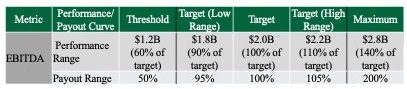
This example illustrates a modestly increasing slope to differentiate payouts between the low target range and the high target range (i.e., incremental changes in performance impact incentive payouts). Alternatively, some companies use a “flat” target range where the payout is 100% of target regardless of where performance falls within the range.
Among companies who utilize either the partial year performance goals or the target range approaches illustrated above, we see little to no negative feedback from proxy advisor firms.
Long-Term Incentive Plan
Long-Term Incentive Vehicle Considerations – Number, Type, and Mix
Our analysis of the cyclical versus less cyclical company data suggests some differences in terms of the number and type of long-term incentive (LTI) vehicles used to deliver equity compensation. Cyclical companies more frequently use two LTI vehicles with greater use of time-based restricted stock and less use of stock options as illustrated below.
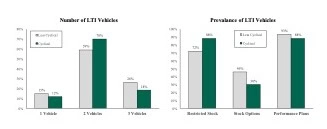
Further, since cyclical companies are less likely to use stock options, they tend to deliver a larger portion of LTI through time-based restricted stock. However, we observed no discernable difference in the mix of value assigned to LTI vehicles when analyzing the use of two LTI vehicles, the most prevalent approach. This value was generally assigned 60% to performance awards and 40% to restricted stock among both the cyclical and less cyclical companies.
The rationale for greater use of restricted stock includes the following:
LTI Performance Metric Considerations
Given the challenges that cyclicality brings to annual incentive goal setting, establishing multi-year performance goals for LTI awards can be an even more daunting exercise. For this reason, cyclical companies are more likely to use relative metrics, most often Total Shareholder Return (TSR), than absolute internal financial metrics, as illustrated in the table below.

The use of relative TSR:
LTI Performance Measurement Considerations
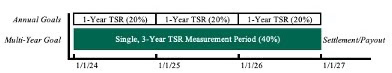
Long-term performance plans often deliver the majority of the total LTI opportunity for senior executives. These programs typically measure performance over a single 3-year period. As noted above, given the volatility and uncertainty associated with operating in cyclical or commodity-sensitive industries, it is often challenging to set 3-year financial goals. Therefore, as an alternative to setting single 3-year performance goals, some cyclical companies establish 1-year performance goals at the start of each calendar year of the 3-year performance period and also set a 3-year cumulative “wrap-around” goal. For those companies that use relative TSR as a metric, a similar approach can be used: three separate 1-year measurement periods and a single 3-year TSR measurement period (as illustrated below). Awards under this approach are determined using an average of results for the four measurement periods and are settled at the end of year 3 in order to maintain the retention value of the LTI.
When analyzing companies with this design, we find that both proxy advisors and some investors scrutinize the plan as being “short term” in nature. However, as long as there is no evident pay for performance misalignment, this design in and of itself does not seem to lead to an “Against” Say on Pay (SOP) vote recommendation or a low SOP vote result. As always, we recommend a fulsome disclosure of the reasons why such an approach is beneficial to the company and its shareholders.
Conclusions
Economic or commodity-induced cyclicality can impact incentive arrangements in a meaningful way. Contemporary market data can provide meaningful insights to companies and their directors on broad industry incentive designs and practices. However, these broadly adopted practices rarely address the problem of compensation extremes inherent in highly cyclical companies. We find the implementation of one or more of the approaches highlighted above begins to mitigate these extreme incentive outcomes. Rarely will the approaches above lead to situations where incentives are paid out at or above target when company performance is below expectations. This situation is more likely due to the establishment of performance goals that fail to reflect growth and execution of business strategies. For companies who have contemplated their unique situation and adopted some of the methodologies above, the result is a highly customized incentive approach that leads to a motivated and engaged executive team.