S&P 500 CEO Compensation Increase Trends

Key Takeaways
- Annual CEO pay among S&P 500 companies has been increasing by the low- to mid-single digits over the last 6 years.
- Historical CEO pay increases have been supported by total shareholder return (TSR) — in fact, annualized pay increases have been 9 percentage points lower than TSR performance.
- We expect that current year (2017) CEO pay will be up in the mid-single digits, given expected revenue and earnings growth achievements and strong TSR performance among S&P 500 companies (year-to-date TSR through September 15 was 13%)
- We expect CEO pay to continue to be a closely monitored topic with the likely implementation of the CEO pay ratio, while we expect that institutional investors will continue to support current pay models at the vast majority of companies despite continued proxy advisor scrutiny.
Summary
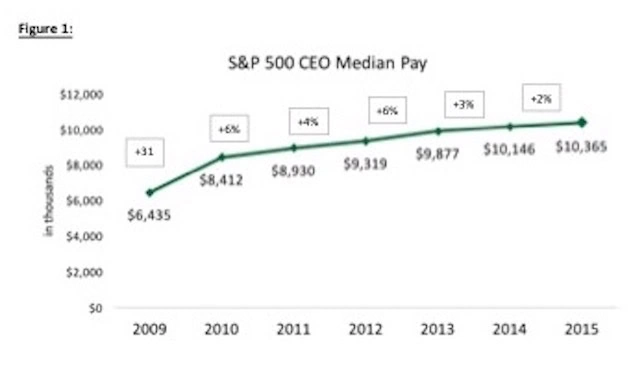
CEO pay continues to be a widely debated topic in the media, within the government, and in the boardroom among investors and proxy advisors. As the U.S. was in the heart of the financial crisis in 2008 – 2009, CEO total direct compensation (TDC = base salary + actual bonus paid + value of long-term incentives) dropped for two consecutive years. As the U.S. stock market sharply rebounded and the economy started to slowly grow again, CEO pay also rebounded. Large pay increases occurred in 2010, primarily in the form of larger long-term incentive (LTI) grants. Since then, year-over-year increases have been fairly moderate – in the 2% to 6% range for the period 2011-2015.
We expect that 2016 CEO TDC will likely be flat or up in the low-single digits (similar to recent years) based on past pay trends, current earnings growth projections, current global economic headwinds, and the relatively slow-growth U.S. economy. Executives in industries with favorable economic conditions will more likely see bigger pay increases than those executives in industries where a slow-down is occurring.
Overall Trends in CEO Pay and LTI Vehicles
CEO pay rebounded 31% in 2010 after two consecutive years of decreases of -9% and -13% during the financial crisis of 2008 and 2009, respectively (source: Equilar). Since then, year-over-year pay increases have been fairly moderate – in the 2% to 6% range.
It is not surprising that CEO pay increases have stalled more recently given that S&P 500 earnings per share growth has been anemic in recent years – in 2015 CEO pay increased 2% while cumulative S&P 500 earnings per share growth was -0.3% in 2015. The low or negative growth in earnings has translated into lower actual bonuses in part offset by slightly higher salaries and LTI grant values.
Over the last six years, LTI vehicle usage has shifted away from stock options, mostly in favor of performance-based plans that pay based on performance versus goal. From 2009 to 2015, the prevalence of performance shares increased from 50% to 86%, stock options decreased from 70% to 56%, and restricted stock increased from 46% to 59% prevalence (see Figure 2).

Trends in CEO Pay versus S&P 500 Index Performance
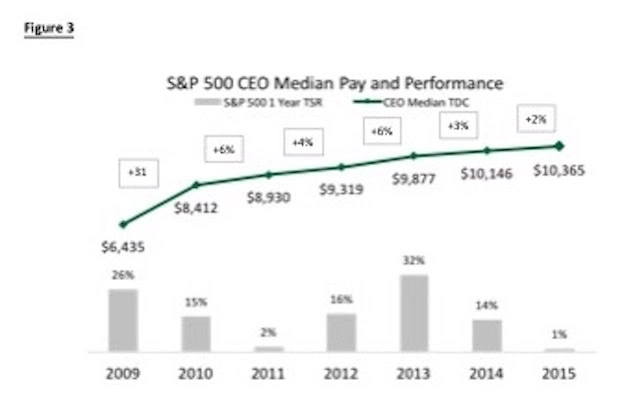
CEO pay increases have been supported by strong operating performance and total shareholder return (TSR) – pay increases over the last 6 years have trailed TSR performance by approximately 5 percentage points based on the Compound Annual Growth Rate (CAGR). Figure 3 demonstrates that in every year that TSR increased, CEO pay increased. The increases in pay were not always proportionate to TSR increase. In each of the last five years (2011-2015), annual pay increases were 6% or less while the S&P 500 total return ranged from 1% in 2015 to 32% in 2013.
There is clear positive correlation between share price performance and CEO pay. In a positive stock price environment, Compensation Committees are often more supportive of CEO pay increases, typically delivered in the form of larger LTI grants. CEO base salaries sometimes only periodically increase (e.g., less than an annual basis) and typically only make up a small portion of the executive pay package. Annual actual bonuses, though not as large as the LTI portion, can have a meaningful impact on whether year-over-year pay increases. Most often when a company is having a good year and exceeding budget goals and investor analyst expectations, the CEO bonus pays above target and increases year-over-year (often the share price also increases as company performance is strong). That said, there will be some years where a CEO’s bonus pays above target as the company exceeded its budgeted goals, while the share price went down due to stock market volatility / correction and sector rotation. The opposite also can happen, where goals are not met, resulting in lower bonuses, while the stock market goes up.
CEO Pay Projections
1) We expect that overall 2016 CEO TDC will be flat or up in the low single digits for many executives in most industries as profits will likely increase slightly from 2015 levels.
a) Our research suggests that CEO pay increases are decelerating (also noted in Figure 1)
b) Aggregate S&P 500 company year-over-year earnings for 2016 are forecasted to be flat or up in the low single digits (source: Capital IQ)
c) S&P 500 earnings are forecasted to be up in 2017, which, if achieved, may influence higher actual pay levels, though media, government, and proxy advisor scrutiny will continue to exert negative pressure on executive pay.
2) In certain industries such as healthcare, executives may experience continued faster growth in total compensation in 2016 while executives in slow growth industries might see a contraction or flat executive pay.
3) We expect general industry executive target pay TDC levels to be flat or up similarly in the low single digits in 2016 and 2017 due to potential for low global GDP growth and uncertain U.S. political environment. The exception would be for executives who outperform their peers and exceed company goals – those CEO’s might see larger pay increases than the norm.
The above pay projections do not account for any potential market setbacks i.e., the nervousness about geopolitical uncertainty, dramatic changes in the economic environment, unexpected changes in the U.S. Federal Reserve’s policies on interest rates, or significant drops in the overall stock market.
Methodology
The CEO pay analysis consists of S&P 500 companies with CEOs in their role for at least three years. Pay data includes base salaries and bonuses paid for each year, as well as the reported grant date fair value of long-term incentive awards. Our analysis of consistent incumbent CEOs was designed to highlight true changes in CEO compensation (as opposed to changes in pay driven by the hiring of a new CEO or internally promoted CEOs who typically experience ramped-up pay over a two to three period).
Note on Realizable Pay
It is important to note that our methodology used year-over-year CEO pay and was based on accounting value of LTI as reported in proxy summary compensation tables. These amounts are more akin to pay opportunity and quite different from realizable pay, which includes in-the-money value of stock options, ending period value of restricted stock and estimated value of performance shares. Pay Governance’s past research has shown there is a very strong correlation between realizable pay and TSR performance. While we have shown that there is a positive correlation between CEO annual pay increases and TSR performance, we are confident that the correlation is not as high as between realizable pay and TSR increases.