S&P 500 CEO Compensation Increase Trends

- CEO median actual pay among S&P 500 companies increased 1% in 2019.
- Overall, CEO pay in 2020 will potentially decline by 3% to 4% due to lower bonuses and many companies underperformed during the unprecedented COVID-19 pandemic disruption.
- Historical CEO pay increases have been supported by historical total shareholder return (TSR); in fact, annualized pay increases have been 9 percentage points lower than TSR performance.
- We expect median CEO target pay increases in early 2021 to be in the low single digits due to some companies providing “supplemental grants” for performance equity that was lost during COVID-19.
- Individual CEO pay increases will continue to be closely tied to overall company performance and peer group compensation increases; it is notable that S&P 500 TSR was +18% in 2020, primarily driven by large-cap technology companies.
- Performance share plan usage seems to have peaked with 94% of S&P 500 companies employing them, while restricted stock has cemented its position with 69% prevalence.
- Stock options have continued their steady decline but are still prevalent at 50% of companies.
- There could be an uptick in stock option and restricted stock usage in 2021 due to the COVID-19 pandemic and companies struggling to set long-term goals in their performance share plans.
Introduction and Summary
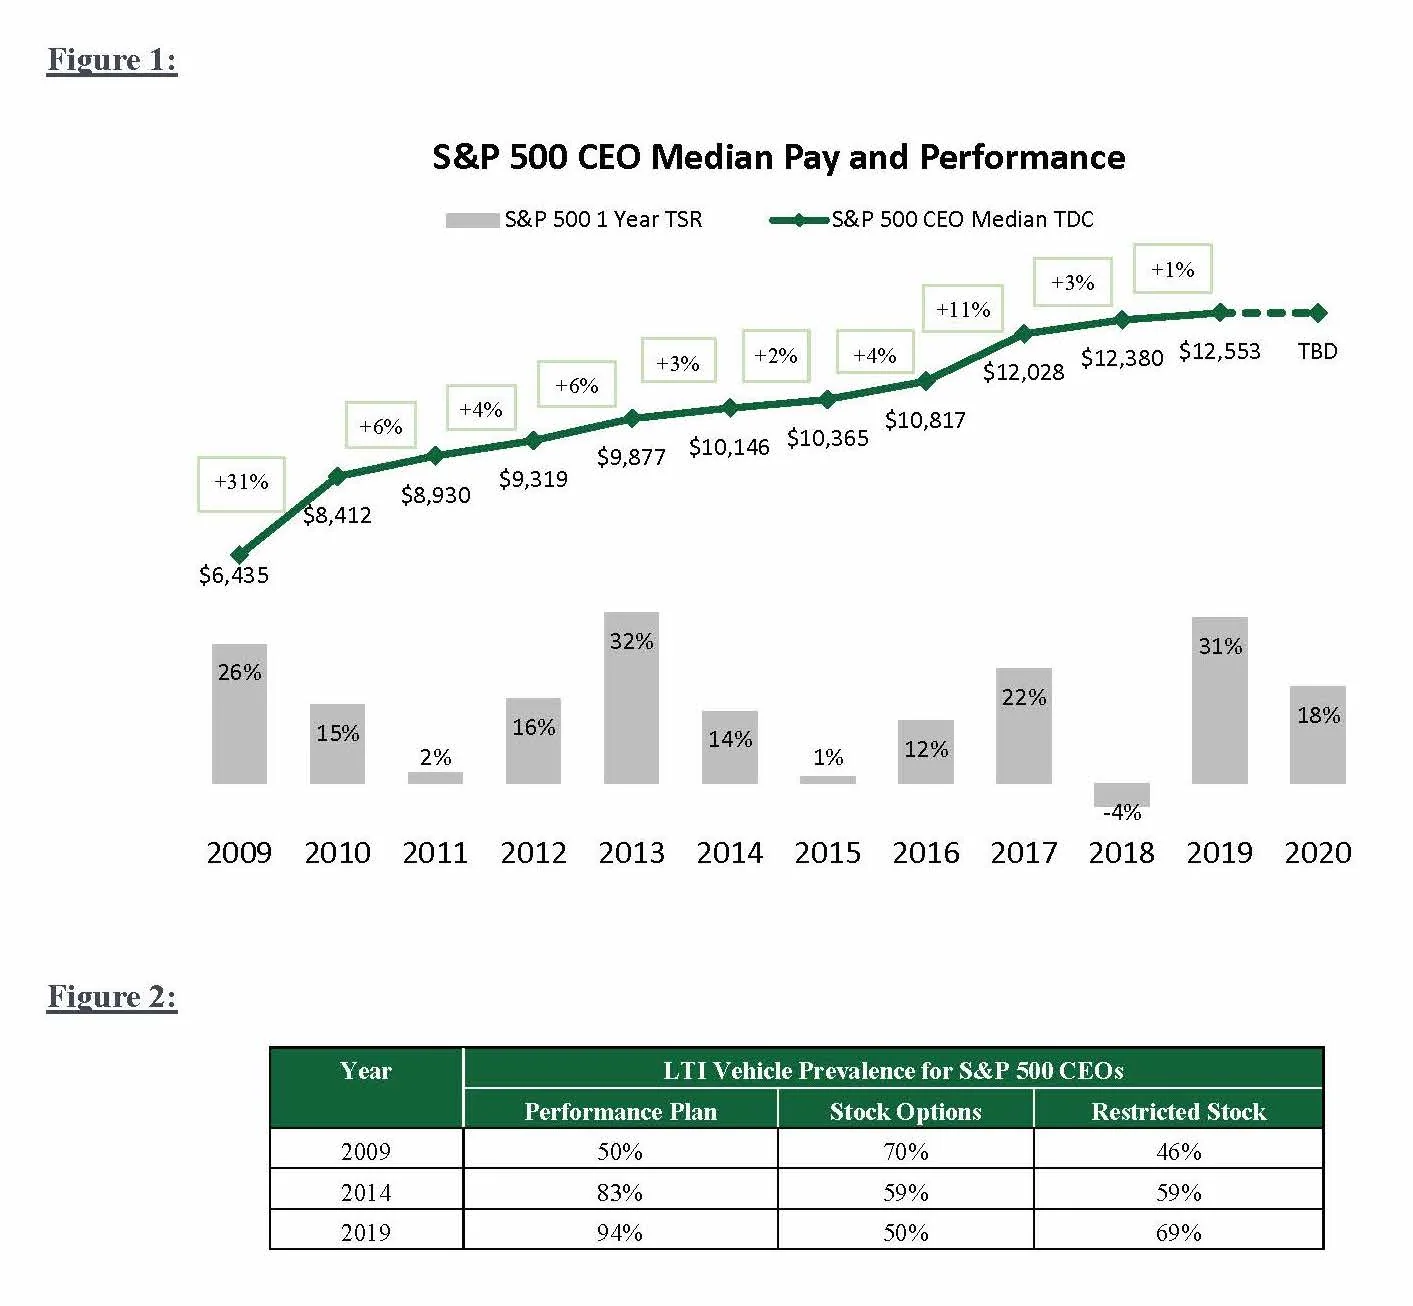
CEO pay continues to be discussed extensively in the media, in the boardroom, and among investors and proxy advisors. CEO median total direct compensation (TDC; base salary + actual bonus paid + grant value of long-term incentives [LTI]) increased at a moderate pace in the first part of the last decade — in the 2% to 6% range for 2011-2016. CEO pay accelerated with an 11% increase in 2017, likely reflecting sustained robust financial and total shareholder return (TSR) performance, before returning to 3% in 2018 and 1% in 2019, more in line with historical rates. Our CEO pay analysis is focused on historical, actual TDC, which reflects actual bonuses based on actual performance; this is different from target TDC or target pay opportunity, which uses target bonus and is typically set at the beginning of the year.
As proxies are filed in early 2021, we expect that 2020 overall CEO actual TDC will decrease, potentially by 3-4%, due to the COVID-19 pandemic and lower bonus payouts – there will be some variation with companies in strong performing industries likely seeing increases in compensation; 2020 actual pay will be balanced by steady base salaries and LTI grants, as most companies had strong financial performance at the time awards were granted (typically Q1). The last time CEO compensation decreased was during the 2008 to 2009 “Great Recession,” where the financial crisis triggered a meaningful contraction in the economy resulting in poor company performance and lower CEO pay. With regard to 2021 CEO target pay, however, we are expecting increases to be in the low single digits primarily due to some companies making “supplemental LTI grants” to partially offset for lost value for performance share plans that were damaged and mostly worthless due to the financial impact of the pandemic. Executives in industries with favorable economic conditions and higher growth (e.g., technology and biotechnology) will likely see more significant pay increases, while those in hard-hit industries may see flat or continued pay declines.
Historical Trends in CEO Pay and LTI Vehicles
CEO pay rebounded 31% in 2010 after -9% and -13% decreases during the financial crisis of 2008 and 2009, respectively. Since then, year-over-year pay increases have been moderate — in the 2% to 6% range — except for the 11% increase in 2017 (Figure 1).
Over the last 10 years, LTI vehicle use has shifted away from stock options, mostly in favor of performance-based plans. From 2009 to 2019, performance plan and restricted stock prevalence increased, and stock option prevalence decreased (Figure 2). The rise in performance-based plans can largely be attributed to the introduction of Say on Pay and the preferences of proxy advisors and some shareholders toward LTI systems that they consider to be “performance-based” (note: the proxy advisors do not consider stock options to be performance-based). This being said, we would not be surprised to see stability in the use of stock options — or even an uptick in usage in the future given the COVID-19 pandemic. Many companies made stock option grants during the depth of the Great Recession in early 2009: this is likely due to the difficulty in setting multi-year goals at the time and the fact that stock options provided a direct linkage to share price improvements and an opportunity for significant upside leverage.
Trends in CEO Pay versus S&P 500 Index Performance
In recent years, CEO pay increases have been supported by strong TSR. In fact, pay increases over the last 9 years have trailed TSR performance by ~9% when examining the compound annual growth rates (CAGR) of compensation and shareholder return: TSR CAGR was 16% while CEO pay grew at 7%. The year 2019 is notable in that during a period of excellent TSR performance (31%), CEO pay increased by only 1% (Figure 1).
There is a positive correlation between share price performance and CEO pay. In a positive stock price environment, Compensation Committees are often more supportive of CEO pay increases, typically delivered via larger LTI grants, while CEO base salaries increase modestly or periodically (i.e., less frequently than an annual basis) and comprise a small portion of the executive pay package. Annual actual bonuses, though not as significant as the LTI portion of total compensation, can have a meaningful impact on whether compensation grows year over year. When a company is having a good year and is exceeding budget goals as well as investor and analyst expectations, the CEO bonus often pays above target and increases year over year (often, the share price also increases as company performance is strong). That said, there will be some years where a CEO’s bonus pays above target when the company exceeded its budgeted goals, while the share price declines due to stock market volatility or correction and sector rotation. The opposite can also happen: goals are not met, resulting in lower bonuses, while the stock market goes up — this is what happened to many companies in 2020 in part due to the COVID-19 pandemic.
CEO Pay Projections
1) We expect 2020 overall CEO actual TDC to decline in the low single digits due the COVID-19 pandemic and weaker financial results that impacted bonus payout decisions; there will be some variation with strong performing industries likely seeing increases in compensation.
a) The Aggregate S&P 500 Index year-over-year revenue and operating income for 2020 are currently forecasted to decrease by 5% and 18%, respectively (S&P Capital IQ).
b) We expect median CEO target pay increases in early 2021 will be in the low single digits as a result of LTI compensation increases primarily due to some companies making “supplemental LTI grants” to partially offset for lost value for performance share plans.
2) In certain high-growth industries (e.g., technology and biotechnology) and high-performing companies, executives may experience increases in total compensation, while executives in slow-growth industries or heavily impacted companies might see no increases or declines.
3) Going into Q1 2021, companies will want to be careful and strike a balance of having competitive executive pay with the public, investor, and proxy advisor expectation that companies exercise restraint in light of the pandemic’s continued disruption.
The above projections assume successful global rollout and broad usage of the COVID-19 vaccine; they do not account for additional major market shocks (e.g., geopolitical uncertainty, dramatic changes in the economic or political environment, significant and unanticipated modifications to the Federal Reserve’s interest low rate policies, or significant drops in the overall stock market).
Methodology
The CEO pay analysis consists of S&P 500 companies led by CEOs with a ‚â•3-year tenure. Pay data includes base salaries and bonuses paid for each year as well as the reported grant date fair value of LTI awards. Our analysis of consistent incumbent CEOs was designed to highlight true changes in CEO compensation (as opposed to changes driven by new hires or internal promotions, which typically involve ramped-up pay over a period of 1 to 3 years).
Note on Realizable Pay
Our methodology used year-over-year CEO actual pay and was based on the accounting value of LTI as reported in proxy summary compensation tables. These amounts are more akin to pay opportunity than realizable pay, which includes in-the-money value of stock options, ending period value of restricted stock, and estimated value of performance shares. Our past research has strongly correlated realizable pay and TSR performance. While we have shown there is a positive correlation between CEO annual pay increases and TSR performance, we are confident the correlation is not as significant as that between realizable pay and TSR increases.