The 2023 Say on Pay Season – Outcomes and Observations

Say on Pay (SOP) votes were mandated by the Dodd-Frank Act of 2010 as a mechanism to allow shareholders to voice their opinions about the level and structure of executive compensation as well as promote the engagement of companies and their shareholders regarding a key area of corporate governance. The general view was that shareholders would increasingly reject executive pay programs by voting against the SOP proposal in years of poor total shareholder return (TSR) performance unless executive pay was reduced. Our findings show that the 2022 and 2023 SOP seasons run counter to this premise for S&P 500 Index companies. SOP failures in 2022 hit a record high (n=22) when TSR performance was strong (1- and 3-year TSR of 27% and 24%, respectively), whereas SOP failures in 2023 unexpectedly decreased (n=11) when TSR performance declined (1- and 3-year TSR of -19% and +6%, respectively).
As published in our recent Viewpoint entitled, “The 2023 Say on Pay Season – Outcomes and Considerations – April 2023,” we reviewed the full history of SOP outcomes for S&P 500 companies beginning in 2011 through 2022. At the time, we anticipated an active and volatile 2023 SOP season given the decline in TSR performance of the S&P 500 Index in calendar year 2022 (down 19%), historically much lower than any previous year in the SOP era. This Viewpoint adds the 2023 SOP season to our previous findings and highlights the outcomes, which were unexpected given the negative TSR performance in calendar year 2022.
Background: Say on Pay 2011-2023
Figures 1 through 3 below have been updated from our prior April 2023 Viewpoint to include SOP outcomes for the 2023 SOP season (through June 30, 2023).
Figure 1: Unfavorable S&P 500 SOP Proposals by Year1
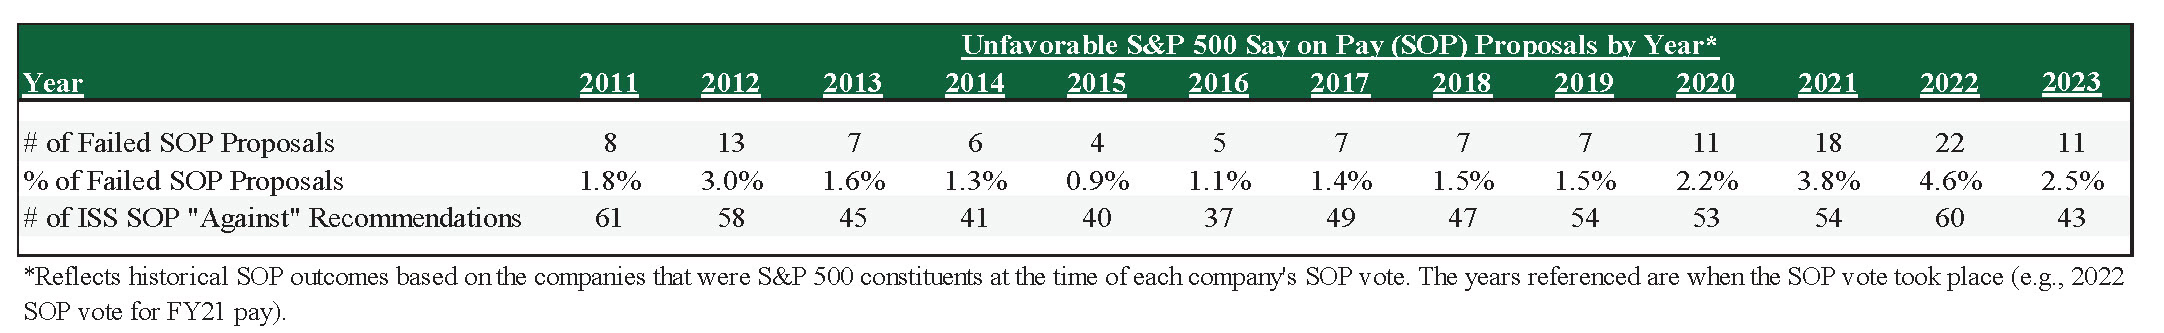
The number of companies failing SOP in 2023 is down by 50% compared to 2022 (the actual number of companies failing SOP decreased from 22 to 11). In other words, 2.5% of companies failed in 2023 versus 4.6% in the previous year (2022). This is likely due in part to only 43 of the S&P 500 companies, or 9.7%, receiving an “Against” SOP recommendation from Institutional Shareholder Services (ISS) ” down from the previous 3-year average of 11.6%.
Figure 2: S&P 500 Historical 1-Year TSR3 & ISS “Against” SOP Recommendations2
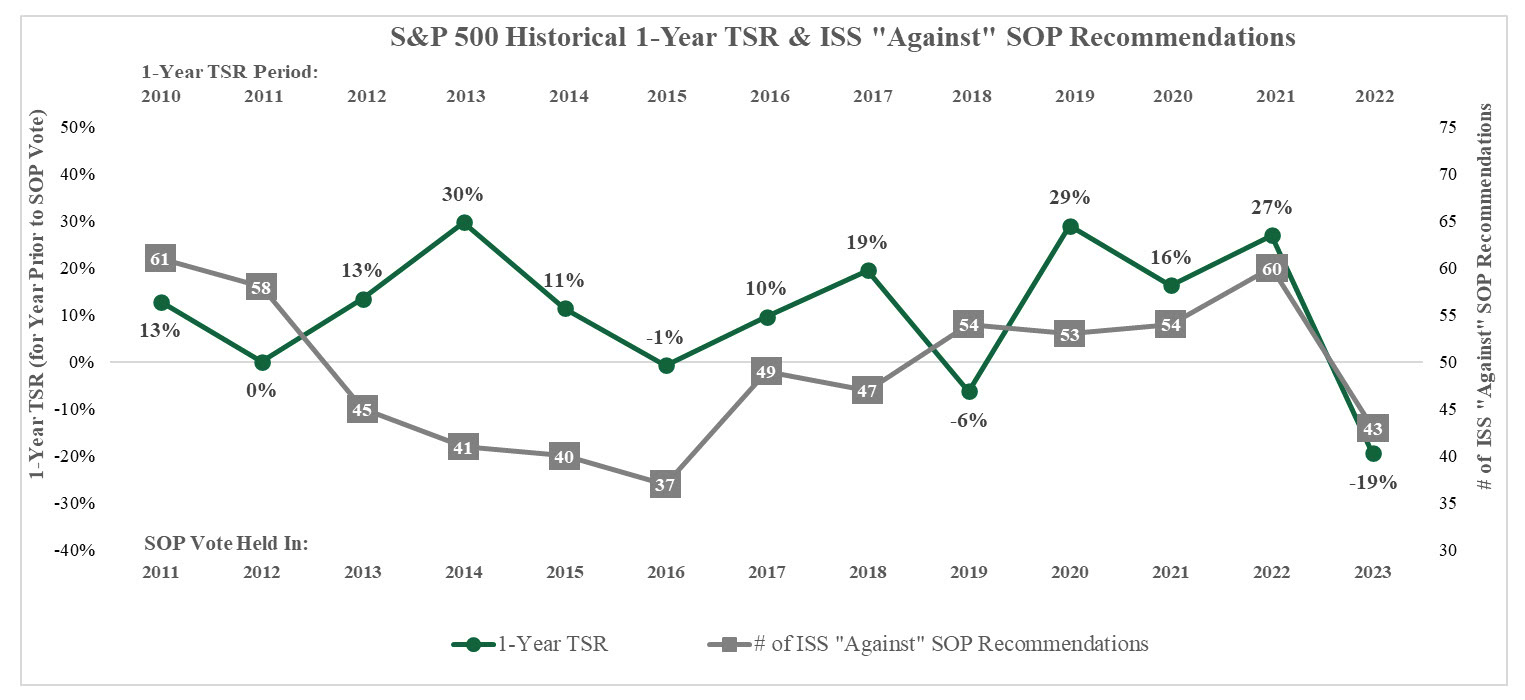
Figure 3: S&P 500 Historical 3-Year TSR3 & ISS “Against” SOP Recommendations2
The number of ISS “Against” SOP recommendations declined to 43 companies through June 30, 2023, compared to the prior 3 years’ average of 56 companies (2020-2022). We note that despite 2022 TSR of-19%, the 3-year cumulative return was a positive 6%, which may have helped mitigate the number of ISS “Against” recommendations and failed SOP votes.
2023 Outcomes
The number of ISS “Against” SOP recommendations in 2023 fell substantially from 2022, from 60 to 43, or a decline of nearly 30% in a year in which the S&P 500 performed at a historically low 1-year TSR of -19%. This performance created an expectation that ISS “Against” SOP recommendations and subsequent SOP failures would increase based on the premise that companies have difficulties reacting to sudden significant drops in TSR with corresponding changes to CEO compensation. For most companies, the majority of CEO compensation has already been determined or granted as they near the end of any 3-year TSR measurement period.
Our careful review of the drivers of an “Against” SOP recommendation by ISS in 2022 and 2023 reveals three areas of change between the 2 years which may have contributed to the reduction in “Against” SOP recommendations and failures, including:
- A decline in companies that received consecutive “Against” SOP recommendations from ISS in back-to-back years (i.e., both 2021 and 2022 versus both 2022 and 2023).
- Improved overall performance on ISS’ Relative Degree of Alignment (RDA) test from 2022 to 2023. The RDA test measures a company’s relative CEO pay rank with the company’s relative TSR rank within an ISS-selected peer group over a 3-year period and has historically been, and continues to be, a significant predictor of ISS “Against” SOP recommendations.
- Some improvement in ISS’ qualitative assessments of other aspects of executive compensation.
We discuss each area of change below.
1. Companies Receiving Consecutive “Against” Recommendations
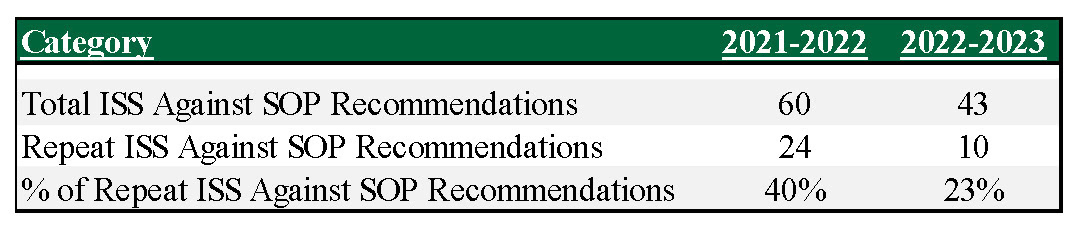
In any given SOP voting season, some companies receive SOP “Against” recommendations from ISS in ‚â•2 consecutive years. The 2022 SOP season featured a historically high 40% of companies with “Against” recommendations in consecutive years, or 24 of 60 companies. The roster of consecutive “Against” recommendations declined significantly in the 2023 SOP season to 23% of companies or 10 companies out of 43 companies receiving “Against” recommendations, a reduction of 14 companies.
Figure 4: Repeat ISS “Against” SOP Recommendations3 ” 2022 versus 2023
We believe the decline in companies with consecutive “Against” recommendations was likely a function of Boards and Compensation Committees taking the necessary actions over the course of 2022 and early 2023 to address shareholders’ concerns with the prior year’s executive compensation program. In some cases, companies may have felt additional pressure to be responsive considering declining 2022 stock prices. Based on our experience as executive compensation consultants, companies understand the changes they need to make to existing compensation programs and practices in a year of a potential SOP failure, especially in the context of declining TSR. Examples of such actions include:
- Changes to relative TSR plans (e.g., targeting the 55th percentile for a 100% of target payout of performance shares rather than the 50th percentile),
- Reduction or elimination of the use of discretion in determining incentive plan payouts,
- Removal of overlapping performance metrics between the annual and long-term incentive plans,
- An increase in the proportion of long-term incentive delivered as performance-based equity, and
- Elimination of “single trigger” vesting or upon a change of control or any remaining “golden” parachute excise tax gross-ups.
While making these changes is not guaranteed to garner a “For” ISS recommendation or shareholder support for SOP, we have found that these changes have contributed to a significant turnaround in the following year’s SOP voting results.
2. Better RDA Performance
We also looked at the underlying reasons for the issuance of an “Against” SOP recommendation from ISS over the 2 years of 2022 and 2023. Specifically, we looked at how many of the companies receiving “Against” SOP recommendations failed each of the three main ISS quantitative pay for performance (P4P) tests in each year: the RDA test, the Multiple of Median (MOM) test and the Pay-TSR Alignment (PTA) test.
Figure 5: Quantitative P4P outcomes for S&P 500 Companies Receiving an “Against” SOP Recommendations3 ” 2022 versus 2023

Our conclusions can be summarized as follows:
- RDA: Companies in the 2023 SOP season performed significantly better on the RDA test than they did in the 2022 SOP season. Of companies receiving an “Against” recommendation, 56% had a “Low” rating on the RDA test in 2023 versus 37% of companies in 2022. Such an outcome means that long-term TSR and long-term CEO pay (both measured over 3 years) are reasonably aligned for most companies receiving an “Against” recommendation. Based upon this conclusion, we anticipate S&P 500 companies in total may have performed better on the RDA test, resulting in fewer “Against” SOP recommendations overall.
- MOM: Companies in both 2022 and 2023 performed about the same on the MOM test, likely resulting in little or no change to the number of “Against” SOP recommendations in 2023 versus 2022.
- PTA: Companies performed slightly worse on the PTA test in 2023 versus 2022, which may have resulted in some increase in “Against” SOP recommendations for 2023.
Overall, companies appeared to perform generally better on the three main ISS quantitative P4P tests in 2023 versus 2022, led by significant improvement in outcomes on the RDA test. This improvement was somewhat offset by overall performance on the MOM and PTA tests; however, the dramatic decrease in ISS “Against” recommendations between years suggests improved RDA scores was a contributing factor to the decrease in the overall number of “Against” recommendations in 2023 versus 2022.
3. Overall Performance Against ISS Qualitative Tests
ISS also undertakes a qualitative assessment of executive compensation programs and practices, reviewing the structures and disclosure of company programs against ISS expectations for such programs. We compared the qualitative assessments cited in ISS’ “Against” SOP recommendations for 2022 and 2023 across six categories. Our objective was to determine if there were significant changes in the categories over the 2 years which may have contributed to the decline in “Against” SOP recommendations and failures. The outcomes are shown in the exhibit below:
Figure 6: Reasons for S&P 500 Companies Receiving an “Against” SOP Recommendation3 ” 2022 versus 2023

We note several observations from Figure 6:
- Overall, from a qualitative perspective, the most significant declines in S&P 500 companies receiving an “Against” SOP recommendation in 2023 were in P4P misalignment, Committee responsiveness, and severance payments.
- P4P Misalignment with Structural/Disclosure Concerns ” this declined as a primary reason for an ISS “Against” SOP recommendation between 2022 and 2023, likely reflecting the generally better performance on the RDA test noted above.
- Sizeable One-Time/Special Awards ” there was an increase in the percentage of companies who received an ISS “Against” recommendation due to the grant of special one-time awards. In general, ISS does not support the use of special one-time awards, especially when such awards are granted without a compelling rationale, are significant in value, and/or are not subject to rigorous performance goals. We believe some companies view the use of special awards as essential in certain situations to ensure retention and to motivate outstanding performance, regardless of proxy advisor reaction to such awards, and are willing to accept a SOP against recommendation from ISS.
- Poor Compensation Committee Responsiveness ” the percentage of companies noted in 2023 was down slightly versus 2022. While this decline suggests companies are taking active measures to connect with major investors to address their concerns, the relatively high proportion of companies cited by ISS as being non-responsive is a warning to companies to solicit shareholder feedback and to act on that feedback following a shareholder vote of less than 70% support for SOP.
- Severance Payments Upon Voluntary Termination ” we note this category disappeared entirely in 2023 as a major reason for a SOP ISS “Against” recommendation, likely reflecting greater awareness by Boards/Committees on how ISS, and its institutional investors, viewed the issue. ISS has strengthened its policy and explicitly states in its voting guidelines that the payment of severance to exiting executives must be due to an involuntary termination (not for cause) that is fully disclosed in the proxy. Otherwise, such payments may result in an automatic “Against” recommendation on SOP.
Conclusion
The 2023 SOP season, which we expected to be a difficult year for many S&P 500 companies due to historically low 1- year and 3-year TSR outcomes, turned out to be fairly benign. ISS “Against” SOP recommendations and related SOP failures declined significantly not only from the high-water mark of 2022 levels but also from levels in 2020-2022. The key drivers of the decline appear to be improved relative TSR performance coupled with heightened awareness of ISS and investor expectations.
As we move beyond the 2023 SOP season and look ahead to 2024, companies should monitor their projected ISS quantitative scores and evaluate potential qualitative concerns to ensure the company’s pay levels and incentive plan design are appropriately rewarding their executive talent to avoid a surprise ISS “Against” SOP recommendation.
___________________________
1. Perla Cuevas, Jose Lawani, Joe Mallin, and Linda Pappas. The 2023 Say on Pay Season – Potential Outcomes and Considerations – April 2023. Pay Governance. April 25, 2023. https://www.paygovernance.com/viewpoints/the-2023-say-on-pay-season-potential-outcomes-and-considerations-april-2023.
2. TSR data for the S&P 500 were collected from S&P’s Capital IQ database.
3. ISS vote recommendations and SOP vote outcomes were collected from ISS Corporate Solutions Voting Analytics database.