Illustrative Disclosure for the SEC’s New PVP Rules

Introduction
During the last week of August, the Securities and Exchange Commission (SEC) released its final set of rules regarding the mandated “Pay Versus Performance” (PVP) disclosure. The new rules are the culmination of various proposals by the SEC dating back to 2015 when the agency first responded to the Dodd-Frank legislative requirement. Pay Governance LLC prepared two recent Viewpoints summarizing our interpretation and analysis of the new disclosure requirements (see Pay Governance Viewpoint on Executive Compensation, SEC Releases Final Rules Regarding Pay-Versus-Performance (PVP) Disclosures dated August 31, 2022 and PVP Q&A: Our Interpretations of the New Pay for Performance Rules dated September 15, 2022).
We stated in the previous Viewpoints that we would supplement our commentary with follow-on analyses and insights regarding the disclosure rules, and this Viewpoint provides an example of both the required and allowed disclosure under the final rule. Regarding supplemental disclosures, the SEC has granted companies significant latitude to include “additional measures of compensation or financial performance and other supplemental disclosures provided such disclosures are clearly identified as supplemental, not misleading, and not presented with greater prominence than the required disclosure”.
Each company will need to decide the form and content of its own PVP disclosure and whether to include supplemental information based on company-specific circumstances, disclosure philosophy, newness of the rules, and other factors. For example, many companies may opt for a more conservative approach in their initial PVP disclosure given the newness of the rules, unresolved interpretative issues, and general reluctance to set a precedent for future disclosures that may not properly reflect the companies’ PVP relationship.
Illustrative PVP Disclosure
The required tabular disclosure, footnotes, and narrative included in this example have been supplemented with optional graphics to assist in visualizing the SEC’s 234-page final rule.
- “Supplemental” column in the PVP table that lists the company’s relative total shareholder return (TSR) ranking compared to its TSR peer group used to vest performance stock units (PSUs)
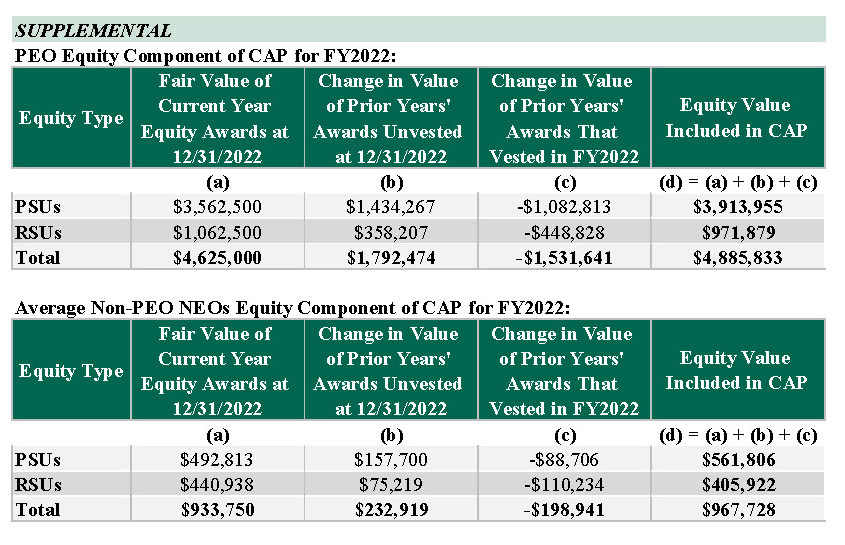
- Footnote to the PVP table that summarizes the key equity components included in the current year’s Compensation Actually Paid (CAP) amount
- Six-year company and peer group absolute TSR to document the company’s 6-year performance in addition to the required 3 years
- Graphic and narrative comparison of SCT total compensation and CAP
- The narrative disclosure includes explanations of why CAP does or not track with each performance measure; the rule only requires a description of the relationship
Required Tabular Disclosure of PVP

Notes:
1. To calculate CAP, the following amounts were deducted from and added to Summary Compensation Table (SCT) total compensation

(i) Reflects “all other compensation” reported in the SCT for each year shown.
(ii) Represents the grant date fair value of equity-based awards granted each year. We did not report a change in pension value for any of the years reflected in this table; therefore, a deduction from SCT total related to pension value is not needed.
(iii) Reflects the value of equity calculated in accordance with the SEC methodology for determining CAP for each year shown. The equity component of CAP for fiscal year 2022 is further detailed in the supplemental table below.
2. The non-principal executive officer (PEO) named executive officers (NEOs) reflected in columns (d) and (e) represent the following individuals for each of the years shown: C. MacArthur, F. Walters, P. Karlowicz, and T. Johnson.
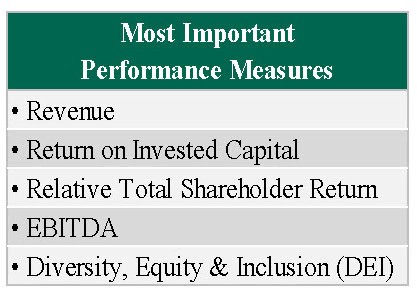
Required Tabular Disclosure of Most Important Measures to Determine FY2022 CAP
The five items listed below represent the most important metrics we used to determine CAP for FY2022 as further described in our Compensation Discussion and Analysis (CD&A) within the sections titled “Annual Incentive Compensation” and “Long-Term Incentive Compensation.”
Supplemental Graphs
1. TSR: Company versus Peer Group
As shown in the chart below, the Company’s 3-year cumulative TSR is less than the companies included in our industry index. There are several reasons for this:
- The Company’s TSR performance for the immediately preceding 3 years far exceeded the peers, and when the 6-year TSR is compared to peers, the Company has significantly outperformed the peers.
- The TSR peer group’s returns are market cap-weighted, and 20% of the companies included in the peer set affected 65% of the weighted return. The Company’s TSR is in line with the unweighted returns.
- The TSR peer group is based on the XYZ index, which reflects the Company’s industry sector; however, many of the companies included in the index are primarily U.S. based and were not as adversely affected by global uncertainty as the Company.

2. CAP versus TSR
As shown in the chart below, the PEO and other NEOs’ CAP amounts are aligned with the Company’s TSR. This is due primarily to the Company’s use of equity incentives, which are tied directly to stock price in addition to the company’s financial performance.

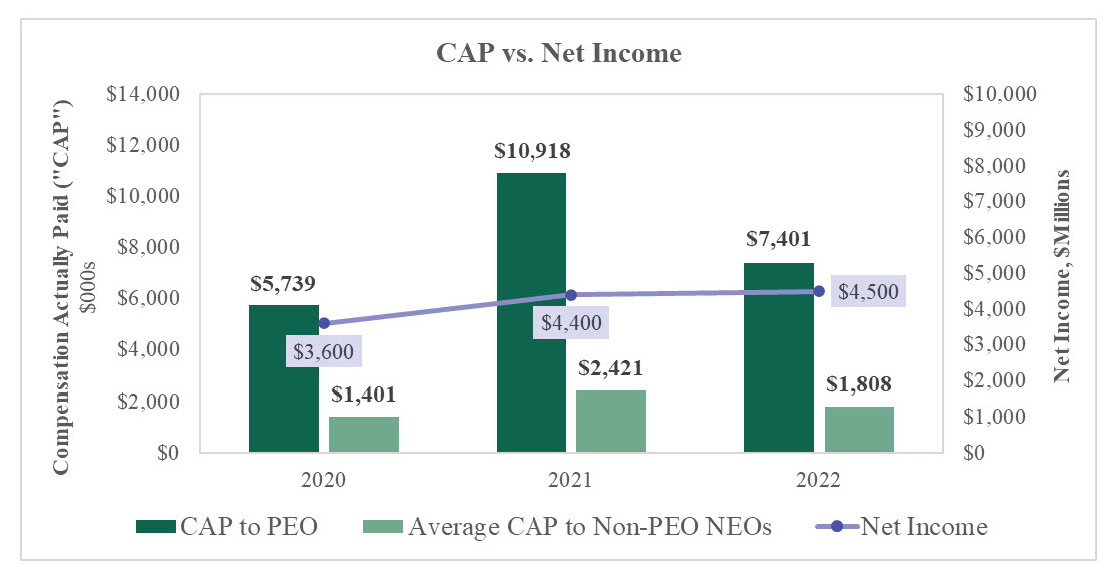
3. CAP versus Net Income
As shown in the chart below, the Company’s net income has steadily increased while the PEO and other NEOs’ CAP has varied significantly each year. This is due in large part to the significant emphasis the Company places on equity incentives, which are sensitive to changes in stock price. In addition, the Company does not use net income to determine compensation levels or incentive plan payouts.
4. CAP versus Company-Selected Measure (CSM)
The chart below compares the PEO and other NEOs’ CAP to our CSM, 3-year relative TSR (rTSR), which indicates there is a very strong relationship between rTSR and CAP. The peer companies used to calculate rTSR are included in the CD&A and include some, but not all, of the companies in the XYZ index. The selection criteria for the rTSR peer group are also included in the CD&A.
The Company’s rTSR determines the number of performance shares that vest for each 3-year cycle, ranging from 0% to 200%. In 2020, the PSUs earned equaled 38% of target; in 2021, the PSUs earned equaled 200% of target; and in 2022, the PSUs earned equaled 25% of target, which is a key driver of the amount of, and change in, CAP.
Because approximately 75% of the CEO’s equity incentives are earned based on rTSR and only 50% of the other NEOs are based on rTSR, the impact of rTSR on CAP — both positive and negative — is more pronounced for the CEO compared to the other NEOs. That is why, for example, 2021 CAP increased more for the CEO than the other NEOs and decreased by more in 2022.

5. SCT Total versus CAP
Although there is no requirement to compare SCT and CAP, the chart below shows SCT compensation has increased modestly while CAP has varied significantly between years. This is due to several factors:
- SCT compensation is based on the grant date value of equity awards made during the year whereas CAP is based on the fair value of equity awards made during the year valued at yearend, plus the change in value of prior year’s awards, including awards granted in 2019, 2020, and 2021. Thus, CAP reflects all or portions of 4 years of equity awards while SCT compensation is based on only the 2022 equity award.
- As discussed under the CAP versus CSM heading, a significant portion of the executive officers’ equity compensation is based on rTSR; in 2021, the company achieved 75th percentile rTSR, resulting in earned shares of 200% of target for the 2019-2021 performance period. This together with the company’s increase in stock price in 2021 resulted in a significant increase in CAP. SCT total compensation was not affected by changes in stock price or rTSR and therefore did not change much compared to 2020.

Conclusion
As noted in our previous Viewpoints, there are several activities companies should undertake now to get a head start on this extensive and complex disclosure requirement. The guidance included in this, and future Viewpoints will remain focused on providing our clients with the insights and information needed to comply with the new rules and to assist in framing their PVP story.
______________