Recap of the 2025 Say on Pay Season

Introduction
Pay Governance has gathered information on Say on Pay (SOP) proposal outcomes and total shareholder return (TSR) for S&P 500 companies dating back to when SOP began with the 2011 proxy season. This article places into context how the most recent 2025 SOP outcomes are unfolding compared to recent history beginning in 2021. In both 2024 and 2025, we found that, overall, companies had greater SOP success, with proxy advisor opposition to SOP proposals and the number of companies failing SOP at record lows. Although the year has not yet ended, about 90% of S&P 500 SOP proposals have already been put to a shareholder vote through August 31, 2025.
Key Takeaways
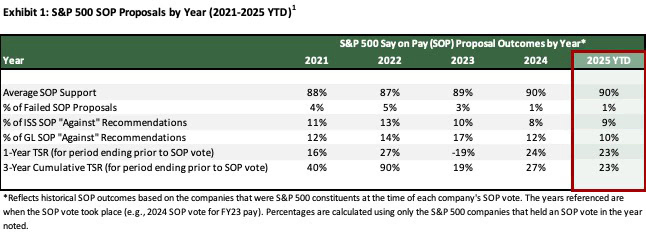
- Improved SOP Support Observed in 2024 Continues into 2025 – The percentage of failed SOP proposals declined significantly from a peak of 5% in 2022 to just 1% in 2024. The failure rate for 2025 year-to-date is again tracking at 1%.
- Proxy Advisor SOP Opposition Has Declined – So far in 2025, Glass Lewis (GL) issued its lowest rate of SOP opposition (10%) in recent years and is converging with the 10% to 12% opposition rates historically observed from ISS. The ISS SOP opposition rate in 2025 of 9% remains low relative to historical rates but is slightly above the 8% dip observed in 2024.
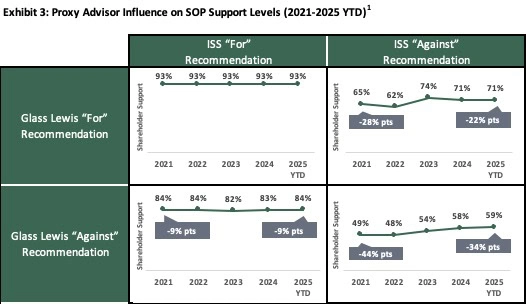
- Proxy Advisor Impact on SOP Outcomes Has Diminished but Remains Influential – The percentage of proxy advisor-opposed SOP proposals that ultimately fail has declined markedly from 2021 to 2025. However, when both proxy advisors oppose SOP, shareholder support levels, on average, are reduced by -34 percentage points (i.e., from 93% support to 59% support).
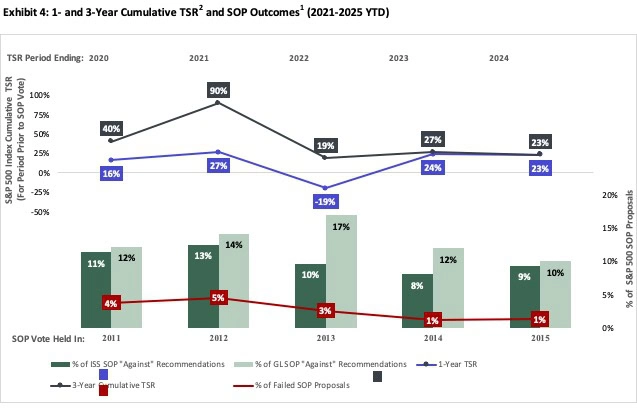
- Sustained 1- and 3-Year TSR Performance Correlates with Stability in SOP Outcomes – The consistent SOP outcomes in 2024 and 2025 mirror the sustained relatively strong 1- and 3-year S&P 500 TSR performance observed for the years ending in both 2023 and 2024.
2025 Year-to-Date SOP Results
Average shareholder support for S&P 500 SOP proposals has been strong and relatively stable over the past 5 years at 87%-90%. Our analysis of 2025 SOP outcomes shows a failure rate and proxy advisor “against” rate that are generally in line with 2024 levels (and below pre-2024 levels). The 2025 SOP failure rate is tracking at 1%, which is comparable to 2024 (also 1%) but below the 3%-5% rate observed in 2021-2023. Similarly, 2025 proxy advisor opposition to SOP proposals is below pre-2024 levels. Notably, Glass Lewis’ 2025 “against” recommendation rate is at an all-time low of 10%.
The lower rate of failed SOP proposals and proxy advisor opposition may be attributed to a continuation of strong TSR performance through fiscal year-end 2024. Further, many companies are increasingly receptive to shareholder feedback on executive pay programs and are taking meaningful actions in response. In addition, large institutional investors are increasingly less dependent on proxy advisors.
Impact of Proxy Advisor Recommendations on SOP Outcomes
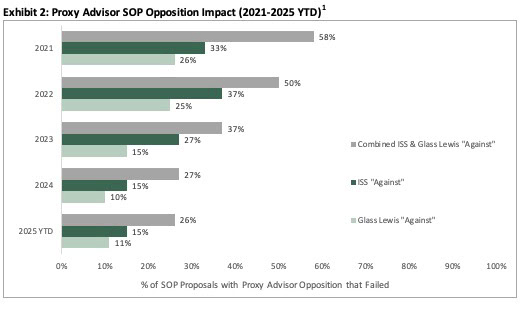
Not only are fewer SOP proposals being opposed by proxy advisors, but the impact of proxy advisor opposition has also dwindled in recent years. As shown in Exhibit 2, we demonstrate proxy advisor impact by the percentage of proposals that fail when an “against” recommendation is issued. In 2021-2022, when ISS opposed SOP, about 35% of the proposals received a failing vote. During this same period, when Glass Lewis opposed SOP, about 25% of the proposals failed. We began to observe a step-down in 2023, with the percentage of failed proposals decreasing to 27% for those opposed by ISS and 15% for those opposed by Glass Lewis. For 2024 and 2025, the percentage of companies failing SOP further dwindled to 15% for ISS and about 10% for Glass Lewis. When both proxy advisors recommend “against” SOP, we observed a more dramatic decline. In 2021, over half (58%) of SOP proposals failed when they were opposed by both proxy advisors; this decreased to about one-quarter (26%) in 2025.
Despite the decline in proxy advisor-opposed SOP proposals that ultimately failed, proxy advisors continue to have a meaningful influence on shareholder support levels. As shown in Exhibit 3, when both proxy advisors recommend in favor of SOP proposals, average shareholder support has remained steady over the past 5 years at 93%. However, when both ISS and Glass Lewis oppose SOP, average shareholder support levels were reduced by -34 percentage points in 2025 (compared to a -44 percentage point reduction in 2021). The influence of ISS opposition on SOP support levels has diminished from a negative impact of -28 percentage points in 2021 to -22 percentage points in 2025. Glass Lewis influence on SOP outcomes has been relatively constant at a -9 percentage-point difference in both 2021 and 2025.
1- and 3-Year Cumulative TSR and SOP Outcomes
As shown in Exhibit 4, we observed an improvement in the correlation between TSR performance and SOP outcomes for proposals held during 2024 and 2025. S&P 500 TSR performance was relatively strong for the periods ending prior to the 2024 and 2025 SOP proposals and reflects an improvement over TSR performance observed prior to 2023 SOP proposals. In 2024 and 2025, we observed commensurate declines in failed SOP proposals and proxy advisor SOP opposition compared to 2023. Findings from our previous Viewpoint titled, “The 2023 Say on Pay Season – Outcomes and Observations,”3 showed that the 2022 and 2023 SOP outcomes ran counter to the premise that TSR performance should be correlated with SOP proposal success.
Conclusion
Overall, S&P 500 SOP outcomes have shown both improvement and greater stability in recent years, with 2025 failure rates and proxy advisor opposition similar to 2024 levels and below pre-2024 levels. The data suggest a stronger correlation between TSR performance and SOP outcomes in more recent years, particularly in 2024 and 2025, where sustained TSR performance is aligned with improved SOP results.
We have seen the influence of proxy advisors diminish in recent years, as measured by the conversion rate of proxy advisor “against” recommendations that ultimately result in failed SOP proposals. However, proxy advisors continue to have a meaningful influence on the level of shareholder support, particularly when both proxy advisors unite in opposition.