The CEO Pay Ratio: How Should Compensation Committees Evaluate Their Ratios? Measuring the Impact of “Median Employee Pay”

Key Takeaways
- Pay Governance’s research shows that pay ratios are more strongly correlated with median employee pay than with CEO pay due to greater variability in median employee pay across S&P 500 companies.
- Despite media implications, this large variability between employee medians potentially has little to do with whether a company pays its employees at “market.” Many other business decisions impact median employee pay, including business model, geographic location, and international operations.
- We used Bureau of Labor Statistics data on average employee pay by industry to evaluate how industry pay influenced the ratios. As expected, we found industry pay had a large impact on employee pay and, in turn, on the ratios.
- At the extremes (top and bottom deciles) of the S&P 500 pay ratios, we found the ratios are driven by a number of important business factors ” especially industry pay, company size, and profitability ” in addition to CEO and median employee pay.
- Thus, there are many elements that make a fair and appropriate comparison between companies, even those within the same industry, technically challenging if not impossible.
- Companies and their boards must continue to focus on the governance and competitiveness of CEO pay and broad-based pay and view their ratio as only one of many other components.
Introduction
For the first time, the Securities and Exchange Commission (SEC) mandated that thousands of companies disclose the ratio of CEO pay to median employee pay (“ratio”) in their annual proxy statements for 2018. The S&P 500 company ratios disclosed thus far show substantial variation, with a median of 155:1 and a range from 0:1 to 5,000:1. While the ratio was never designed to facilitate cross-company comparisons, recent media coverage has done just that, and company management teams and Boards are asking, “What does our ratio mean, and where does our pay ratio stand versus those of our competitors?” Answering this is more complex than it may seem. There are many economic, organizational, and strategic variables that make fair and appropriate comparison between companies, even those within the same industry, technically challenging if not impossible.
How can the Compensation Committee, or perhaps the entire Board, evaluate their own CEO pay ratio? There are many dimensions to this. Our research focuses on two aspects:
1. How much of the pay ratio variation is associated with CEO and/or median employee’s pay?
2. What variables affect the pay ratio, and which drive a ratio to the extremes of the public company distribution?
Pay Governance’s research, as summarized below, uses statistical analysis to answer these questions and suggests a nuanced and more accurate approach for assessing company pay ratios by Compensation Committees and Boards.[1]We have studied S&P 500 companies due to their media attention, their role in the original legislative intent, and their relatively high ratios compared to other companies.
Background
In our study of 389 S&P 500 companies, the median CEO pay level is $12.1 million, consistent with many other studies. The median of the “median employee pay” level, as disclosed in the ratio section of the proxies, is $70,129. This latter value has surprised many observers, as it is much higher than expected and ” more importantly ” 39% higher than the average U.S. private sector salary of $50,620 (142 million employees).[2]This employee pay level was previously unknown.
But what is the origin and context for these numbers? The mandated pay ratio was one of several new executive pay rules under Dodd-Frank in 2010. In legislative response to the 2008 financial crisis, Dodd-Frank was written with the explicit intention of preventing future crises. In addition to regulating financial institutions, the legislation included executive pay rules creating greater shareholder engagement (e.g., the ratio and say-on-pay votes) for public companies with the intention of reducing the presumably deliberate “excessive” risk-taking of executives at all companies (not just financial services).
At the time, some advocates of the ratio legislation “explained that the pay ratio would serve as a ‚Äòsimple benchmark’ to ‚Äòhelp investors monitor both how a company treats its average workers and whether its executive pay is reasonable.'”[3]Nevertheless, Congress did not discuss the explicit objectives for requiring companies to calculate and disclose the pay ratio.[4]In their public interpretation/guidance, the SEC alerted users that the ratio “should be designed to allow shareholders to better understand and assess a particular registrant’s compensation practices and pay ratio disclosures rather than to facilitate a comparison of this information from one registrant to another“[5](italics added for emphasis). Despite this careful guidance, media coverage is making just such comparisons despite their questionable economic validity.[6]
Whatever the guidance, there have been numerous media stories on companies and their ratios. These have included some dramatic examples comparing similar companies in the same industry (communications and consumer products) with vastly different ratios due to vastly different business models.[7],[8]The different ratios apparently stem from valid economic differences ranging from outsourced manufacturing to geographic location and franchise operations.
Most company Boards agree with the SEC that inter-company ratio comparisons are hardly accurate. This incomparability can be easily explained. While the level of CEO pay clearly impacts the ratio, Compensation Committees set their CEO’s pay with great precision based upon relatively transparent and accurate market data from publicly available proxies.[9]This process and its governance has yielded relatively low CEO pay variability.[10]However, a given company’s disclosed median employee pay is more varied than CEO pay; thus, median employee pay is potentially more impactful on the ratio.
This larger variation occurs because each company is disclosing the pay of a single employee.[11]This one employee’s pay level and the overall pay structure are impacted by many opaque, firm-specific business model issues including internal equity (ranking), market, and other company variables. These market variables include the likelihood of broad and variable geographically diverse (national and international) labor markets for that industry/occupation. Thus, a company’s specific median employee pay cannot be directly compared with that of another company in a different industry or even compared with an industry peer that has a different business model. Despite the media’s implications, this large variability could have little to do with whether either company pays its employees at “market.” A company could pay its general employee population at or above the median of its industry, properly evaluated, and yet have a disclosed median employee pay level below the median of a company, even one in the same industry. Regardless, this one employee pay level has an immense impact on the ratios and their incomparability. Our statistical analysis below supports this theory.
Question 1: How much of the variation in pay ratios is associated with the CEO’s and/or median employee’s levels of pay?
While both CEO and employee pay clearly impact the ratio, many observers believe that CEO pay is the most impactful; this belief was one of the reasons the ratio legislation was created. However, when discussing the pay ratio comparison between companies, we reduce four labor markets to a single comparison/ratio.[12]Since our S&P 500 sample includes companies in many industries, there is a broad distribution of median employee pay, ranging from lower medians in consumer products and retail to higher medians in utilities and financial services. While CEO pay varies across industries, it is more homogeneous than employee pay across industries and company size within S&P 500 companies given that the role has relatively consistent expectations and responsibilities.
To measure this relationship statistically, we conducted two single-variate correlations ” one measuring the correlation between the pay ratio and CEO pay and another measuring the correlation between the pay ratio and median employee pay. As shown in Table 1, we found a higher correlation for employee pay with the ratio than for CEO pay: the pay ratio’s variability was caused by changes in median employee pay more so than changes in CEO pay. The negative sign on the median employee correlation indicates an inverse relationship between median employee pay and the pay ratio: as median employee pay increases, the ratio decreases.
Table 1: Relationship Between CEO Pay and Median Employee Pay With Pay Ratio, Respectively[13]
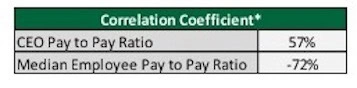
*These correlation coefficients measure the statistical relationship between two variables.
We evaluated several variables and models to determine the relative impact of CEO and employee pay on the ratio and consistently found that employee pay was more impactful than CEO pay.
Question 2: What business decisions drive the CEO pay ratio, and how should Compensation Committees consider them?
Table 1’s findings are somewhat intuitive.[14]CEO pay has relatively low variability and is primarily driven by company size and industry.[15]Median employee pay across S&P 500 companies, on the other hand, varies more due to more business elements: it is highly dependent on each company’s industry, business model, geographic employee distribution, and employee skill level. However, as shown in Table 3 below, a company’s employee pay does not vary as much with size for these largest companies in the U.S. economy.
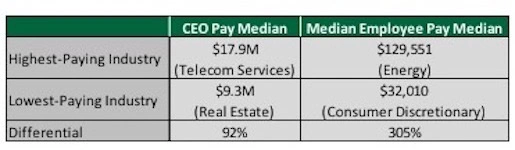
The median of “median employee pay” at these companies ($70,129) is substantially above the average salary in the U.S. economy. There is substantial variation for employee pay by industry but not by company size. Table 2 shows there is much larger industry variation for employee pay than for CEO pay. This variation explains the correlation differences shown above.
Table 2: Variability of CEO Pay and Median Employee Pay by Industry
In contrast, Table 3 below shows that the relationship is inverted for company size, with company revenue impacting CEO pay significantly more than employee pay.
Table 3: Variability of CEO Pay and Median Employee Pay by Revenue Scope
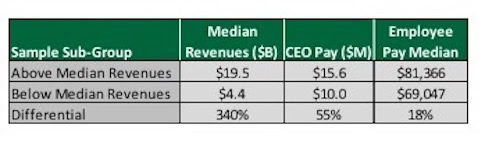
Industry and size”and their opposite impact on the ratio”are further support for ratio incomprability between companies or relative to the overall median ratio of 155:1.
Comparing Attributes for High and Low Pay Ratio Companies
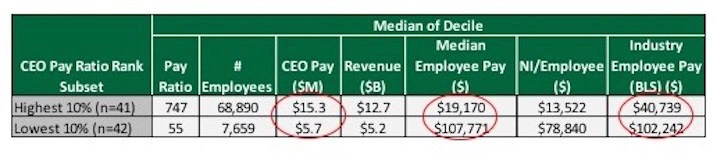
To develop an even more targeted understanding of how specific scoping, talent strategy, and business model components affect the CEO pay ratio, we examined several variables for companies in the top and bottom pay ratio deciles of the S&P 500. Table 4 below summarizes our findings and allows us to make several conclusions about how CEO pay and employee demographics affect the ratio. The difference between the ratio deciles on each economic variable are quite dramatic.
Table 4: Comparing Attributes of Companies with Top and Bottom Decile Pay Ratios
Company Size:
The high-ratio companies are much larger than the low-ratio companies: high-ratio companies have revenues of $13B and 69,000 employees while low ratio companies have revenues of $5B and 7,700 employees. Both factors significantly impact the ratio. The high revenue for the high-ratio companies is associated with higher CEO pay, but the larger headcount is also associated with lower employee pay, as explained below.
CEO Pay:
High-ratio companies (top 10% with a 747:1 pay ratio) have median CEO pay of $15.3M. Low ratio companies (55:1 pay ratio) have median CEO pay of $5.7M. These findings suggest that CEO pay above the study’s median has some impact on the high pay ratio, but there is another crucial element missing that is driving top-decile pay ratios: employee pay.
Median Employee Pay:
We find that median employee pay is a larger driver of high CEO pay ratios. While the lowest ratio companies have median employee pay of $108,000, the highest-ratio companies have median employee pay of $19,000 (around 17% of the high ratio company employee pay). Is it possible that the high-ratio companies consistently underpay their employees relative to the appropriate labor market? After examining company median pay versus industry pay data below, we have reached the following conclusion: “No.”
Employee Labor Market Pay:
To explore this issue, we determined the Bureau of Labor Statistics (BLS) industry employee pay value for each company based on its industrial classification code. We used the BLS compensation database to determine whether a company’s employees are in a high- or low-paying labor market (in comparison to the median of all industries). This BLS average pay level is not the actual market data that any company primarily uses for developing its internal compensation structure for employees. Further, it is essential to remember that a company’s median employee pay used for the ratio is the middle employee out of tens or hundreds of thousands of employees. Further, millions of these employees are located outside the United States and thus not included in the BLS data. These employees are frequently paid less than their U.S. counterparts.
Thus, a single national market average for an industry, even one covering millions of employees, cannot be indicative of the labor market for all employees at the company. However, by using the BLS average, we used a valid index of relative pay levels for employees among a wide variety of industries.[16]While not comprehensive, the BLS data was a powerful analytical technique for reviewing 400 companies. We found that:
- High-ratio companies in the study are in industries that have lower market pay levels as demonstrated by BLS labor market data– $40,739. This is lower than the annual mean national wage in 2017 of $50,620. While higher than median employee pay for top-decile pay ratio companies, the median employee pay figures provided by each company include non-U.S. employees while BLS data only reflect U.S. employee pay. Overall, the lower industry pay levels for the high ratio companies indicate that at least part of the high ratio in the top decile companies was explained by lower industry pay levels.
- Low-ratio companies, on the other hand, are in industries that have higher market pay data with a median of $102,242. This indicates that the higher median pay for the low-ratio companies may be consistent with the industry labor market, and may not be as impacted by non-US employees as the high-ratio companies.
Profit Per Employee:
We evaluated profit per employee, measured as net income/employee (NI/ee), as another indicator of the industry economics, business model, and employment strategy.[17]Companies with higher profit per employee tended to pay their employees more than those with lower profit per employee.[18]Table 4 shows that the high pay ratio companies had profit per employee of $13,522 compared to $78,840 for the lowest ratio companies.
Overall Commentary:
Companies with low ratios were likely to have low CEO pay (including founders or CEOs with prior mega-grants). However, the large companies with the highest ratios may have had typical CEO pay but lower median employee pay. This could be explained by large offshore employee populations, a large number of retail/part-time employees, and other differences in legitimate employment strategies.
Taken together, these facts illustrate why pay ratio comparisons, particularly between the highest- and lowest-decile pay ratio companies, are potentially problematic. We believe it is not appropriate to compare a pay ratio for companies with several thousand highly-skilled employees (IT, finance, utilities) against companies with tens or hundreds of thousands of employees, many of whom may be part-time or based offshore (retail, offshore manufacturing).
A more complete statistical model of the CEO Pay Ratio
As discussed, there are many variables”some measurable and some not”that will impact the ratio at a given company, such as large variations in business model and the actual labor market for employees.[19]We conducted additional statistical analysis which simultaneously include the factors above”company revenues, variation in CEO pay, variation in median employee pay, and profit per employee”for further insights.
We conducted a multi-variate statistical analysis adjusting the model for the above factors to isolate the impact of CEO pay levels and median employee pay on the overall pay ratio. Our findings, after adjusting for company size and labor market, supported our study’s overall findings. While both CEO and median employee pay had major impacts on the ratio, employee pay had a larger impact.
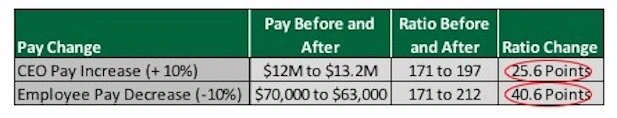
Table 5 shows that, at the median ratio, a 10% increase in CEO pay increased the ratio by 25.6 points (from 171:1 to 197:1), while a 10% decrease in employee pay increased the ratio by 40.6 points (from 171:1 to 212:1). This is further evidence that the employee pay level is at least as impactful on the ratio as the CEO pay level, if not moreso.
Table 5: Regression Model Effect of 10% Change in CEO Pay and Employee Pay
Alternate approaches for navigating the pay ratio
Consistent with the SEC’s guidance, our own statistical analyses suggest that direct pay ratio comparisons between companies are fraught with technical and structural issues. Thus, we recommend that companies and Boards proceed with caution. However, questions on pay ratio may arise, and the public pay ratio disclosure creates another topic for public and stakeholder engagement, particularly for companies with pay ratios on either extreme of the distribution.
To the extent that Compensation Committees do seek to compare their ratio to the market, we advise carefully structuring a group of comparison companies which most likely will differ from the peer group used for executive pay benchmarking. Since we demonstrate that employee pay is the more significant driver of the pay ratio, any comparison group should focus on companies with similar broad-based employee demographics: that means similar head counts, geographic distribution of employees, employee skill level, and staffing models (e.g., part-time versus full-time).
Ideally, a company may be able to develop a group of five to ten public business competitors with similar employee demographics that would make for appropriate pay ratio peers. However, some of the largest S&P 500 companies may have few appropriate companies for comparison, if any, and pay ratio comparisons or benchmarking should not be forced in such cases.
Instead, we believe companies should take a principles-based approach to considering pay equity that focuses on the appropriate talent market for executives and broad-based employees, respectively:
1) Are the compensation practices and levels for both executives and employees consistent with the company’s business strategy and philosophy? While some stakeholders may second-guess a company’s compensation program (i.e., a high level of CEO pay and low level of employee pay), an economically successful company will create productive jobs with competitive pay over the long term.
2) Are executive compensation setting processes and disclosures exhaustive and consistent with good governance standards? Is say-on-pay support high?
3) Are broad-based pay levels fair and competitive for the level of skill, experience, and hours of employment? Have these levels been confirmed with market data?
4) Do broad-based pay structures represent a competitive wage for full-time employees in the local economy?
5) Have recent company-wide surveys identified pay as a concern? Where did pay stand in relation to other concerns?
Conclusion
The CEO pay ratio is a new development in public company disclosures situated at the intersection of politics, sociology, and business economics. While the pay ratio’s political and sociological causes and potential effects are beyond the scope of our research, Compensation Committees at U.S. business corporations must hold an appropriate understanding and interpretation of pay ratio results. Before undertaking cross-company CEO pay ratio comparisons, it is important that pay experts and Committee members understand the unique labor market features that drive the components of each company’s ratio and that any comparisons are economically sound and not an overly simplified “benchmarking” exercise. Ultimately, we believe that the most appropriate means of considering the pay ratio is to ensure that both CEO and employee pay are periodically reviewed against the competitive labor market to be competitive, fair, and well-governed.
______________________________________
This Viewpoint is intended to inform Compensation Committees, executives, and compensation professionals about developments that may affect their companies; it should not be relied on as providing specific company advice or as a substitute for legal, accounting, or other professional advice.